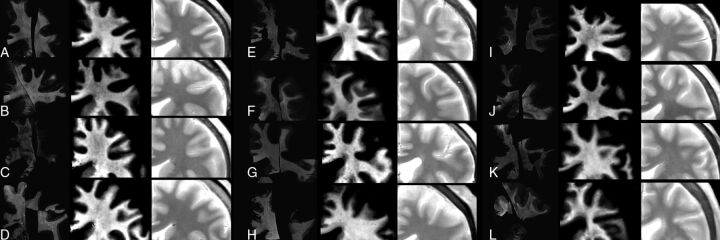
Fig 3.
Zoomed-in images of all subjects, ordered according to increasing age (A, 46; B, 47; C, 52; D, 55; E, 59; F, 61; G, 69; H, 70; I, 70; J, 71; K, 72; and L, 74 years of age). On the left, the registered LFB stains are shown as optical density, in the center is the MR imaging–detected myelin partial volume, and on the right is the synthetic PD-weighted images.

