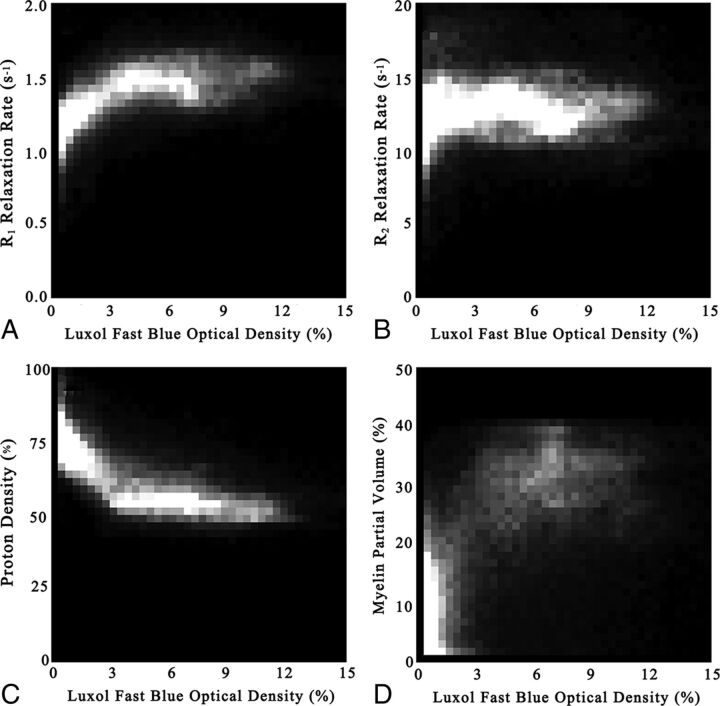
Fig 4.
2D histograms of all subjects of the Luxol fast blue optical density values, plotted as a function of the observed R1 relaxation rate (A), R2 relaxation rate (B), and proton density (C). Also, the estimated myelin partial volume, based on temperature-corrected R1, R2, and PD is plotted (D). The intensity of the 2D histograms corresponds to the number of times a value occurs within each value interval. Intervals were divided into 40 × 40 bins.

