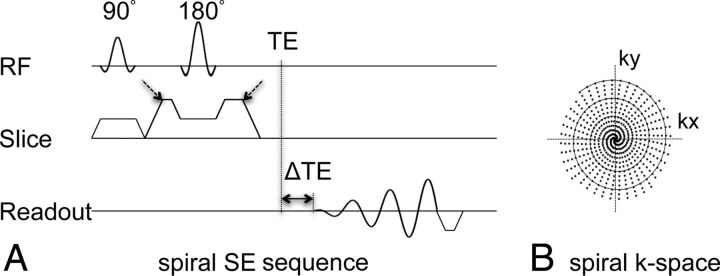
Fig 1.
Pulse sequence diagram of the proposed 2D spiral SE sequence (A). ΔTE indicates the temporal shift of the spiral readout relative to the traditional TE (ie, the Hahn echo). Spiral data at multiple ΔTE shifts (−0.2, 0.57, and 1.34 ms used at 3T) were collected in this work to facilitate chemical shift–encoded water-fat imaging. The dashed arrows point to the crusher gradients in the section direction used to spoil through-plane flow signal. B, The solid circular tracing shows 1 spiral interleaf, and the dots indicate sampled data points in k-space from all interleaves, as summarized in Table 1. RF indicates radiofrequency.

