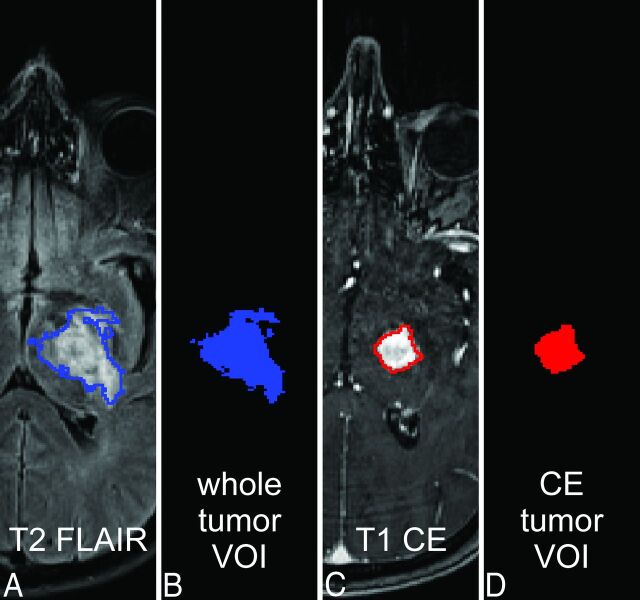
Fig 1.
Tumor masking. The T2 signal of tumor and perifocal edema is shown on an exemplary T2-FLAIR image (A) of a patient with GG (ID no. 2, On-line Table 1); it is the basis of the whole tumor VOI (A and B, blue). CE tumor portions (C) define the CE tumor VOI (C and D, red). All tumor VOIs were created by using ilastik (see Materials and Methods; Image Processing; and On-line Appendix, Methods).

