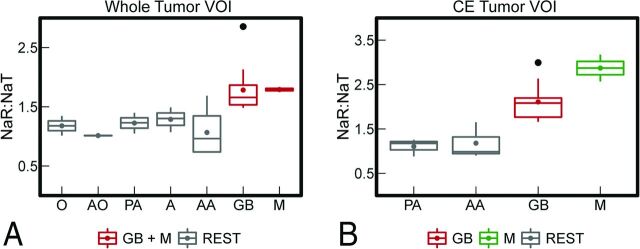
Fig 3.
NaR:NaT values of different tumor classes. The boxplots visualize the mean NaR:NaT of the whole tumor VOI (A) and the CE tumor VOI (B) for different tumor classes. Because of the low sample size, gliomatosis cerebri (n = 1), anaplastic ependymoma (n = 1), and anaplastic oligodendroglioma (n = 1) are not depicted. For NaR:NaT of the whole tumor VOI, GB could be separated from all other gliomas (REST) but not from metastasis. NaR:NaT of the CE tumor VOI enabled all (CE) gliomas to be separated from each other except for PA versus AA (REST). Moreover, GB can be differentiated from metastasis. The box extends from the lower to upper quartile values of the data; lines represent the median; and colored filled circles depict the modal. Vertical axes indicate the range of the data; flier points are shown as black filled circles. O indicates oligodendroglioma; AO, anaplastic oligodendroglioma; AE, anaplastic ependymoma; GC, gliomatosis cerebri; A, astrocytoma; M, metastasis.

