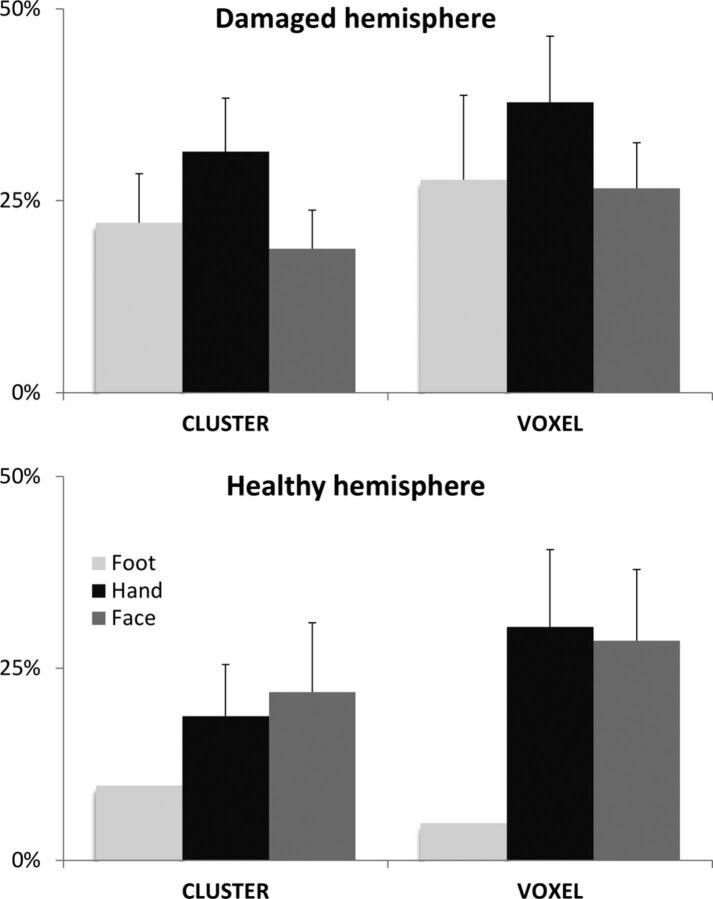
Fig 3.
Overlap between tb-fMRI and rs-fMRI. Average (and standard error of the mean) concurrent ratios are displayed for the damaged hemisphere and the healthy hemisphere. Different body parts were moved during tb-fMRI, leading to 3 ratio calculations: foot (light gray), hand (black), and face (dark gray). Two different thresholding strategies were tested for tb-fMRI analysis: a test based on the cluster size (cluster) and another one based on the voxel intensity (voxel).

