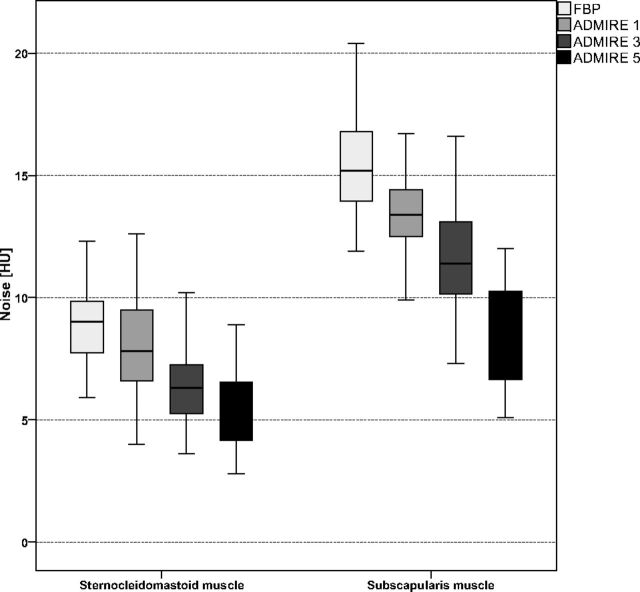
Fig 1.
Boxplot graph shows comparison of image noise of the sternocleidomastoid and subscapularis muscles between the different image reconstruction settings. Image noise of the sternocleidomastoid muscle and subscapularis muscle was significantly lower with all ADMIRE levels, with the best results for ADMIRE 5 (all, P < .001). Noise in the lower part of the neck, represented by the subscapularis muscle, was significantly increased within each reconstruction mode compared with the upper part of the neck, represented by the sternocleidomastoid muscle (all, P < .001).

