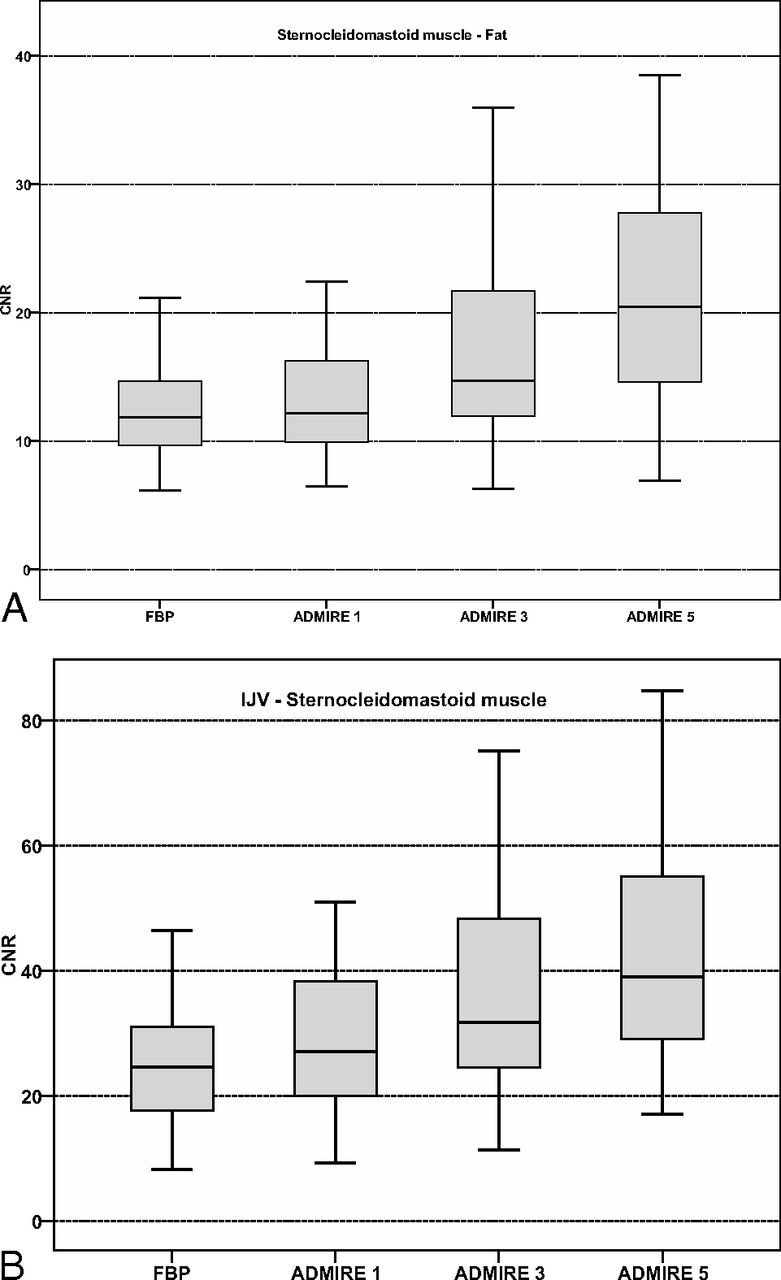
Fig 3.

Boxplot graphs show contrast-to-noise ratios of sternocleidomastoid muscle-to-fat (A) with significantly higher results in ADMIRE strength levels 3 and 5 compared with FBP and ADMIRE 1 (P < .001), while internal jugular vein–sternocleidomastoid muscle CNR (B) is significantly increased in all ADMIRE strength levels compared with FBP (all, P < .001).
