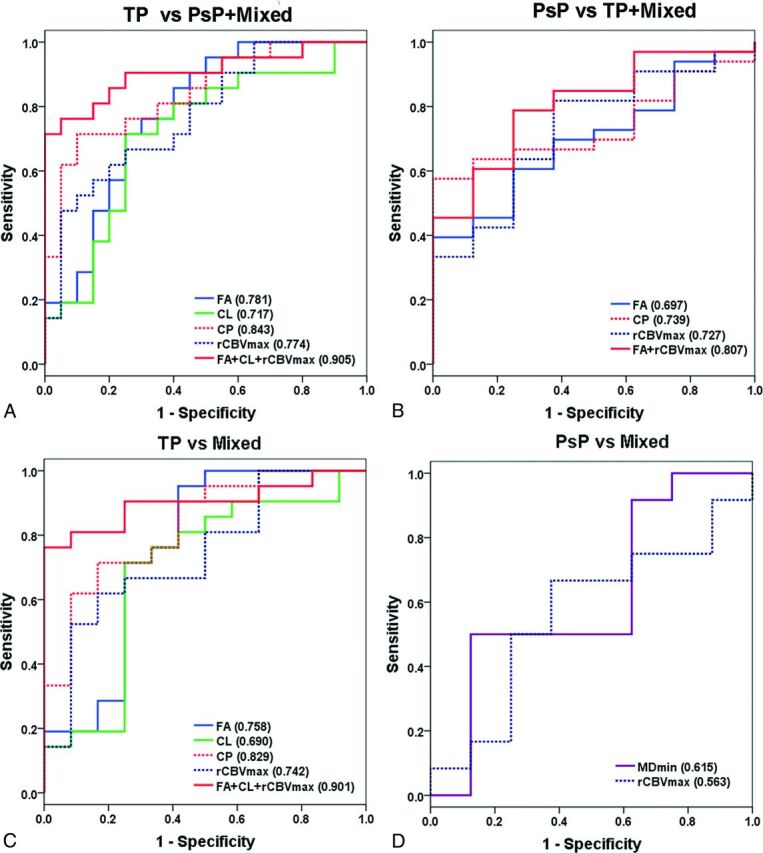
Fig 5.

Receiver operating characteristic curves of the imaging parameters for identifying different groups. The numbers in the parentheses show AUC values. The logistic regression model of FA, CL, and rCBVmax from the enhancing part of the tumor was the best predictor for differentiation of TP from non-TP, including PsP and mixed response with an AUC = 0.905 (A). This model can also distinguish TP from mixed tumor with an AUC = 0.901 (C). A combination of FA and rCBVmax differentiates PsP from non-PsP (TP and mixed) with an AUC of 0.807 (B). There is a significant overlap between the PsP and the mixed group, and only MD is shown to have some predictive value with an AUC = 0.615 (D).
