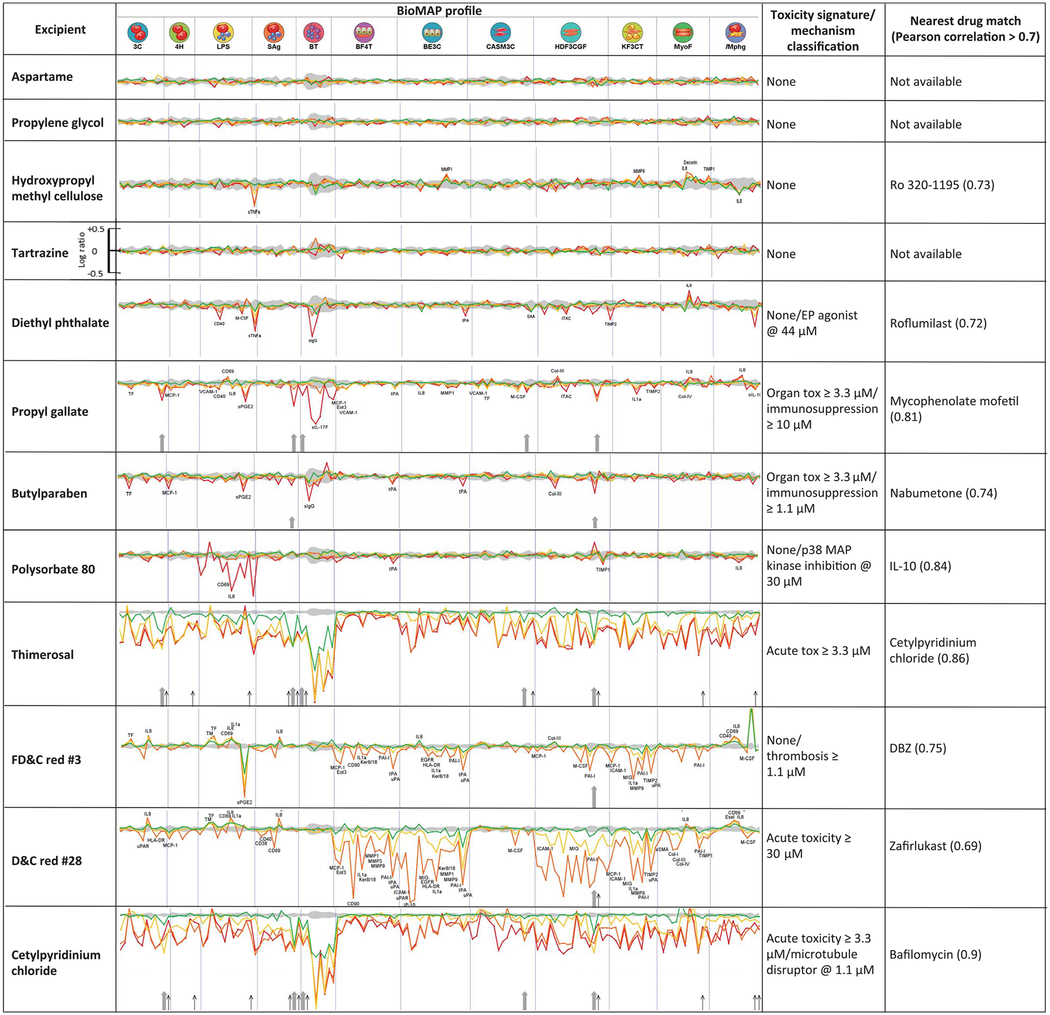
Table 3. Excipient activity in cell-based model systems.
BioMAP Diversity PLUS profiles for 12 excipients are shown. Each section of the spectrum corresponds to a different cell or tissue system (22). Profiles represent concentration responses across the assays: green, 1.1 μM; yellow, 3.3 μM; orange, 10 μM; red, 30 μM. Upward and downward strokes represent increased and decreased levels, respectively, in log scale (see tartrazine for reference). The gray shaded area represents the baseline response range. The rightmost columns show toxicity signatures and the closest drug matches from the BioMAP database with corresponding correlation between the two profiles. Cytotoxicity is indicated by thin black arrows; antiproliferative effects are marked by gray arrows. Cell types corresponding to assay codes: 3C, venular endothelial cells (VECs); 4H, VECs; LPS, peripheral blood mononuclear cells (PBMCs), endothelial cells (ECs); SAg, PBMCs, ECs; BT, PBMCs, B cells; BF4T, bronchial epithelial cells (BECs), dermal fibroblasts; BE3C, BECs; CASM3C, coronary artery smooth muscle cells; HDF3CGF, fibroblasts; KF3CT, keratinocytes, fibroblasts; MyoF, lung fibroblasts; iMphg, macrophages, VECs. See supplementary materials for detailed explanation. For measurements on all tested excipients, see figs. S2 to S13.

|
