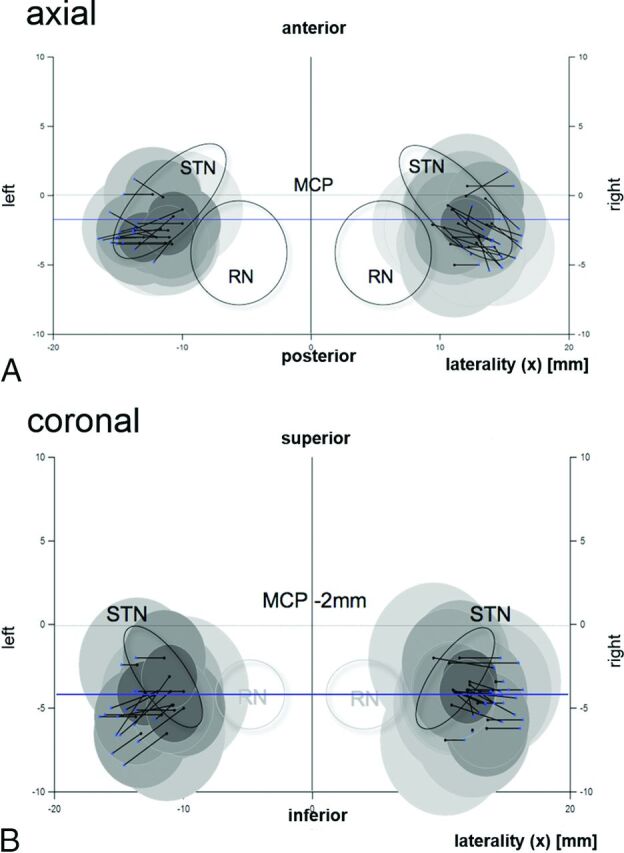
Fig 5.

Graphic depiction of the EPio experiment results. Atlas templates in axial (A, 6.2 mm below the midcommissural point [MCP]) and coronal sections (B, 2 mm behind the MCP) (idealized according to Schaltenbrand and Wahren46). Intraoperative electrode positions are represented by black dots. Black lines represent the shortest distance in space to the CST as depicted with the DTI technology. Blue dots show the individual CST penetration in space. Shaded circles indicate estimated volumes of activated tissue around a test electrode, specific to the current that was applied to elicit an electrophysiologic CST response according to Ranck (1975), (Fig 1).20 CST (blue dots) corresponds nicely with electric field borders, indicating that medial CST definition with DTI reliably predicts the CST border as measured with electrophysiology. RN indicates red nucleus. (Of note in A, the CST is always located posterior and lateral to the STN region.)
