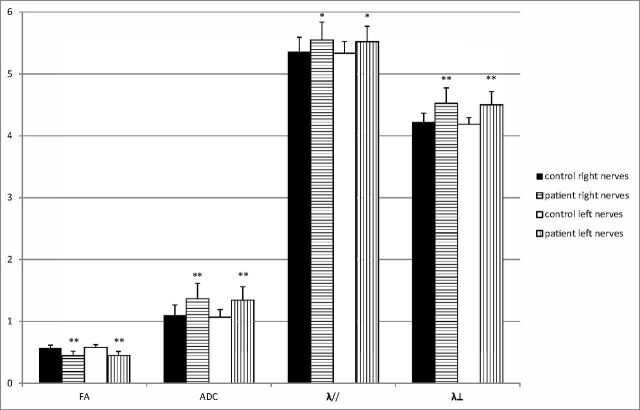
Fig 3.
The DTI measures of both right and left ONs of patients are compared with corresponding normal ONs of controls. Bar graphs of mean FA, ADC, principal eigenvalue, and orthogonal eigenvalue averaged across the right and left optic nerves are shown in 38 patients with RP compared with the homolateral optic nerves of 35 controls. The error bars denote the SDs across subjects. The units of the ADC, λ//, and λ⊥ measures are in ×10−3 mm2 per second−1. The asterisk indicates a significant difference compared with the homolateral nerves of controls (*P < .01; **P < .001).

