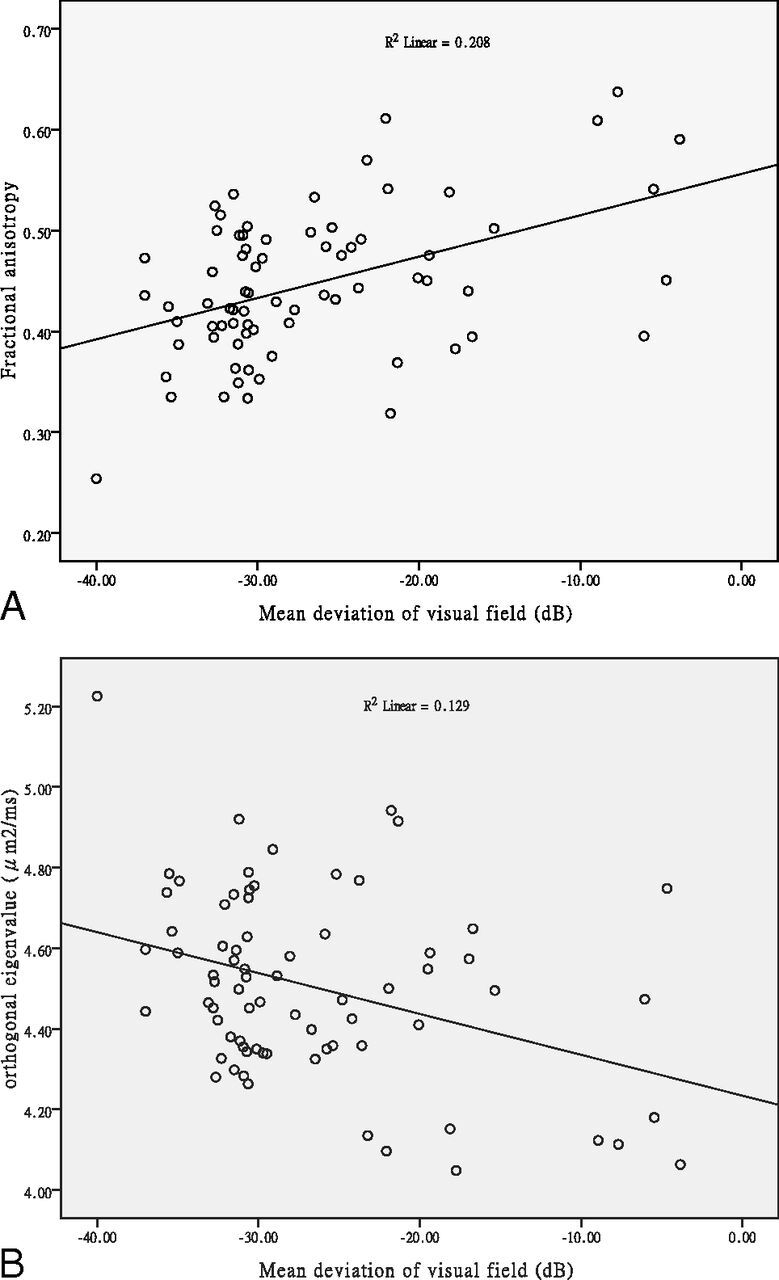
Fig 4.

Correlation of DTI data with visual function. Plot of FA and orthogonal eigenvalue versus mean deviation of the visual field, respectively, averaged across the pixels inside the ROIs along the optic nerves of 38 patients with RP (76 affected eyes).
