
Fig 1.
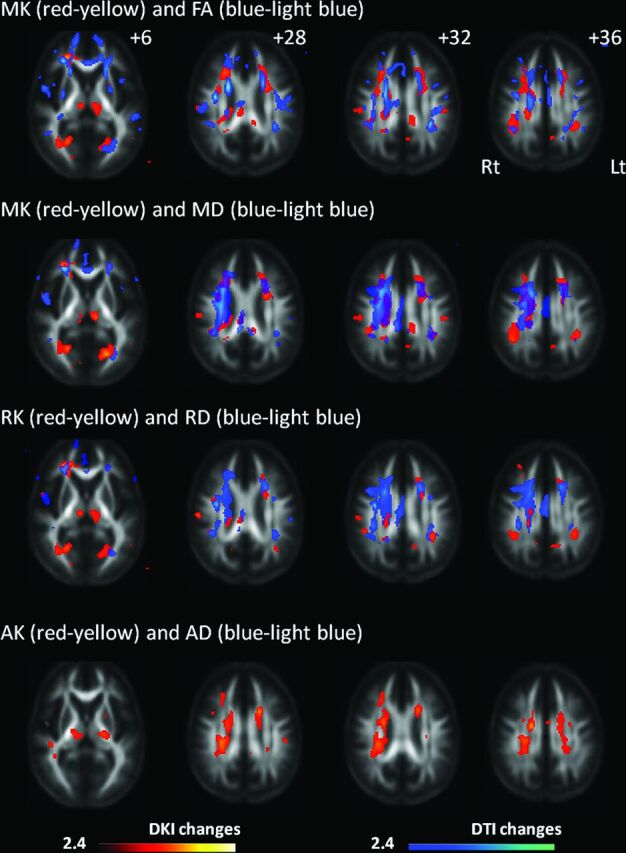
Changes in diffusional kurtosis imaging and diffusion tensor imaging parameters in Moyamoya disease shown in maps of 3 diffusional kurtosis parameters (mean kurtosis, radial kurtosis, and axial kurtosis) and 4 diffusion tensor parameters (fractional anisotropy, mean diffusivity, radial diffusivity, and axial diffusivity). Areas with significant changes in a combination of DKI/DTI parameters are as follows: decreased MK (red-yellow)/decreased FA (blue-light blue), decreased MK (red-yellow)/increased MD (blue-light blue), decreased RK (red-yellow)/increased RD (blue-light blue), and decreased AK (red-yellow)/increased and decreased AD (blue-light blue). Values from statistical parametric mapping analysis are projected onto axial sections of the average brain space of FA (z = 12, 28, 32, 36 mm). MK decrease is observed in the thalamus, a portion of the genu and body of the corpus callosum, corona radiata, frontoparietal subcortical white matter, and superior longitudinal fasciculus. RK decrease is observed in part of the frontoparietal subcortical white matter, thalamus, corona radiata, and occipital white matter. AK decrease is observed in the thalamus, temporo-occipital white matter, part of the SLF, and corona radiata. The radiologic convention is adopted, with the left side of the brain on the right side of axial panels. The color scale represents T values, with colored regions exceeding the significance threshold of P < .01 (T = 2.42) with a minimum cluster size of 50 voxels. Rt indicates right; Lt, left.