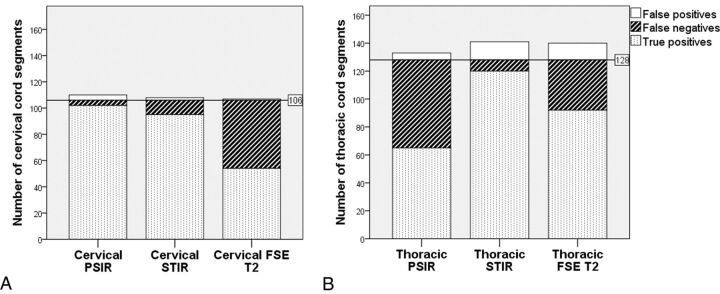
Fig 2.
Stacked bar charts show the total number of true-positive, false-negative, and false-positive spinal cord segments in the cervical (A) and thoracic (B) regions on the 3 different sagittal sequences evaluated. The horizontal lines represent the total number of segments truly affected by lesions as per criterion standard evaluation.

