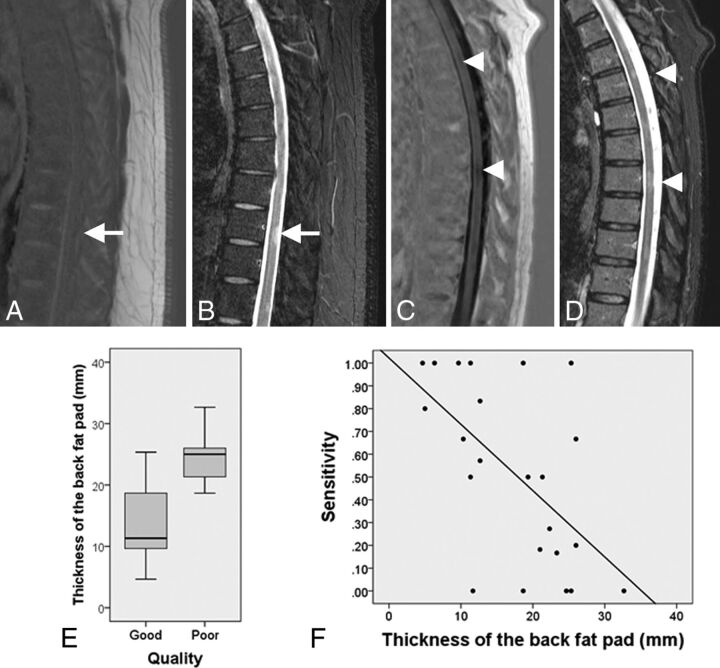
Fig 3.
A, Thoracic sagittal PSIR image of a patient with MS with a thick back fat pad shows increased noise and failure of CSF suppression. A demyelinating lesion (white arrow) is clearly identified on STIR (B) but not seen on PSIR (A). Sagittal PSIR (C) and STIR (D) sequences of a slim patient with MS show adequate contrast between the lesions (arrow caps) and the cord and adequate CSF signal suppression on PSIR. E, The boxplot shows the distribution of the variable thickness of the back fat pad in the group of patients with good- and poor-quality thoracic PSIR images. The bottom and the top of the boxes represent the 25th and 75th percentiles, respectively; the median is represented by the horizontal line in the box; and the range corresponds to the whiskers that extend from the box. Patients with poor-quality PSIR sequences of the thoracic spine have a median back fat pad size significantly thicker than that in patients with good-quality images. F, The scatterplot shows the negative correlation between the sensitivity of the PSIR sequence of the thoracic segment and the thickness of the back fat pad (r = −0.53).

