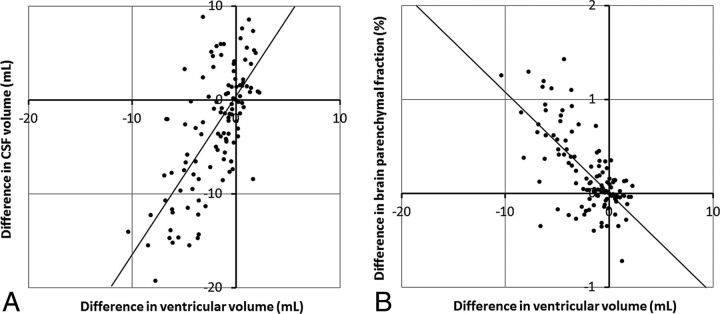
Fig 4.
A, Correlation plot between the difference in ventricular volume and the difference in total CSF volume for all subjects at all time points. The line indicates a slope of 1.67 and intercept of 0.37. B, Correlation plot between the difference in ventricular volume and the difference in brain parenchymal fraction for all subjects at all time points. The line indicates a slope of −0.104 and an intercept of 0.008.

