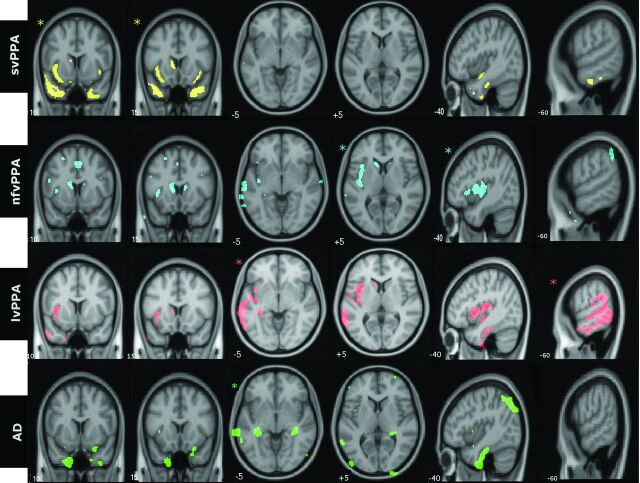
Fig 1.
Group-level patterns of atrophy in identical axial, sagittal, and coronal sections of the brain. Images are displayed in neurologic orientation. Asterisks demonstrate the section most representative for the particular groups. All comparisons were made at false discovery rate–corrected P < .01.

