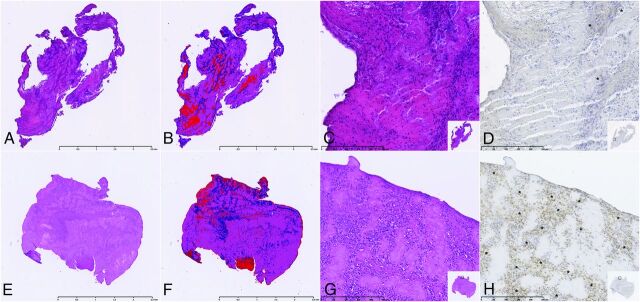
Fig 3.
Histologic specimens of 2 different clots with H&E staining (magnification ×30) (A and E), segmentation of RBC (red), F/P (purple), WBC (blue), and staining artifacts (brown) for composite quantification (B and F). H&E staining (magnification ×200) (C and G) and NE staining (magnification ×200) (D and H) with accumulation of NE-positive cells marked (asterisks). Clot composition is the following: upper row: 30% RBC, 51% F/P, 19% WBC; NE index 1; lower row: 7% RBC, 84% F/P, 9% WBC, NE index 4.

