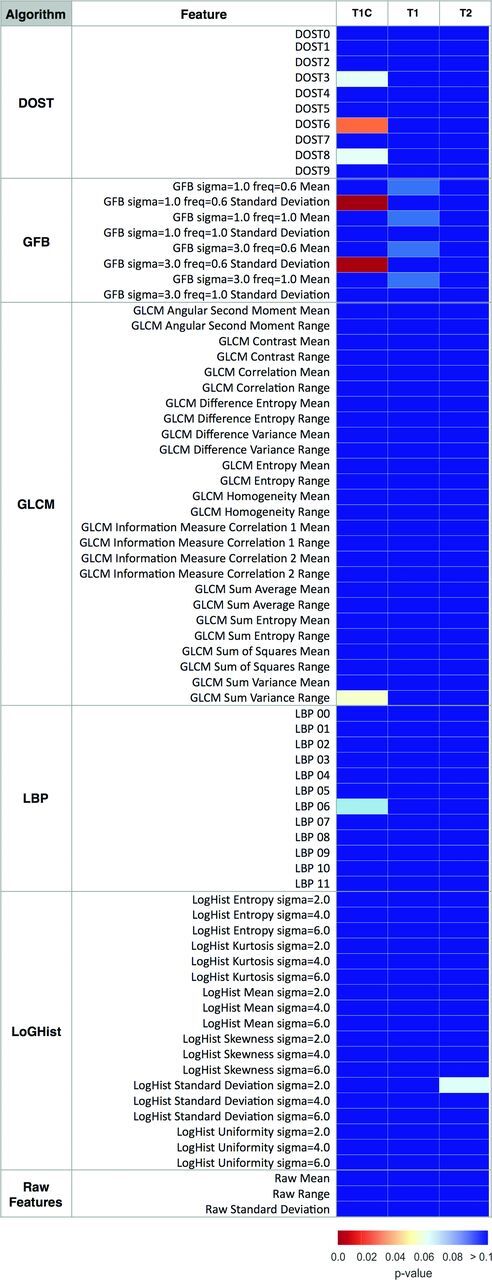
Fig 2.

Heat map showing MR imaging texture feature significance in distinguishing tumor type. Univariate analysis compared the pathology status (SCC versus IP) with MR imaging–texture features. Color maps show the false discovery rate–adjusted P values of a 2-sample t test. MR imaging contrasts (pulse sequences) are listed above the columns, and MR imaging–based texture features are listed in rows. DOST features 0–9 correspond with low-to-high frequency patterns. LBP 0–11 are the normalized bin counts in the LBP histogram. The reader is referred to the “Materials and Methods” section for additional details about the features.
