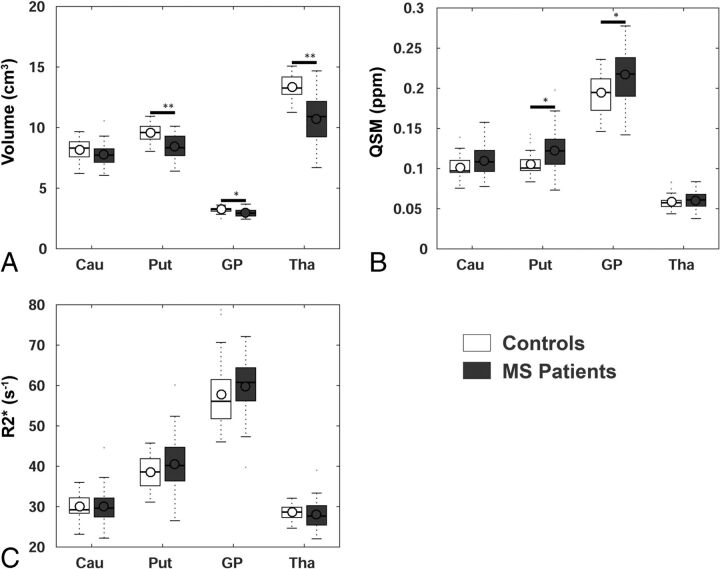
Fig 2.
Group differences in age-, sex-, and intracranial volume-normalized deep gray matter volumes (A) and iron based on QSM (B) and R2* (C). Boxplots show ranges of the first-to-third quartiles, circles indicate means, lines inside the boxes indicate medians, dotted lines indicate the fence (1.5 interquartile ranges), and outliers are shown by dots outside the fence. Cau = caudate; Put = putamen; GP = globus pallidus; Tha = thalamus; double asterisks = P < .001; asterisk = P < .01.

