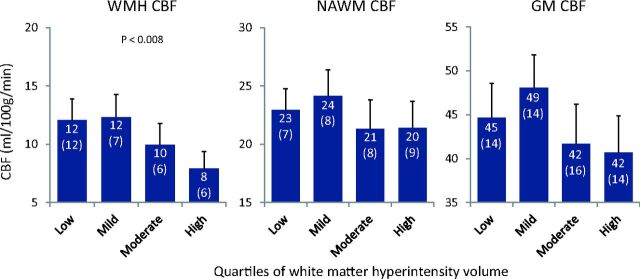
Fig 2.
Cerebral blood flow per quartiles of WMH load. Cerebral blood flow in the gray matter, normal-appearing white matter unaffected by WMHs, and white matter hyperintensities in subgroups based on quartiles of WMH volume. Shown are means (SDs) and significant P values of 1-way analysis of variance.

