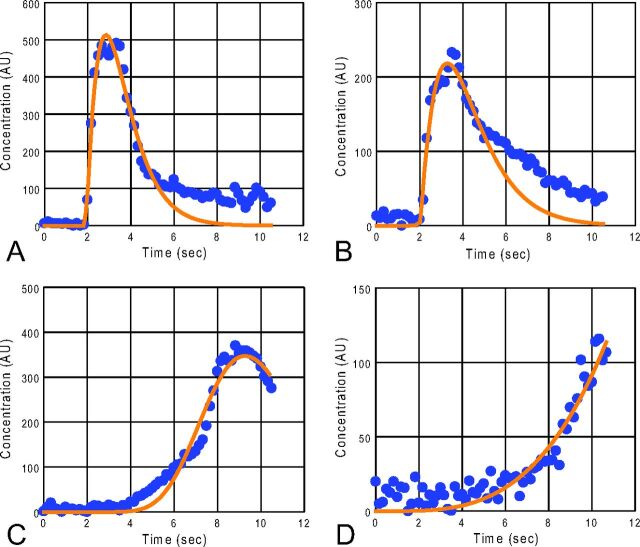
Fig 3.
Measured (blue circle) and fitted (orange line) time-concentration curves of representative ROIs before the stent-placement treatment: ICA2 (A), M2 (B), PV (C), SSS (D). Note that the time-concentration curve of the PV (C) lacks the middle and lower descending portion. The ME in the time-concentration curve of the SSS (D) is at the last temporal point. AU indicates arbitrary unit.

