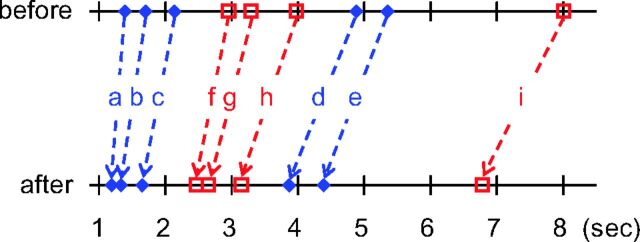
Fig 5.
Comparison of the mean BAT (blue, a–e) and mean TTP (red, f–i) before (upper line) and after (lower line) treatment for different vascular ROIs in the lateral view: ICA1 (a and f), ICA2 (b and g), M2 (c and h), PV (d and i), and SSS (e). The TTP and rTTP are reduced after treatment in the extracranial (a and f) and intracranial segments, being more obvious in segments between the ICA1 and the PV (a–d and f–i) and less obvious from PV to SSS (d and e).

