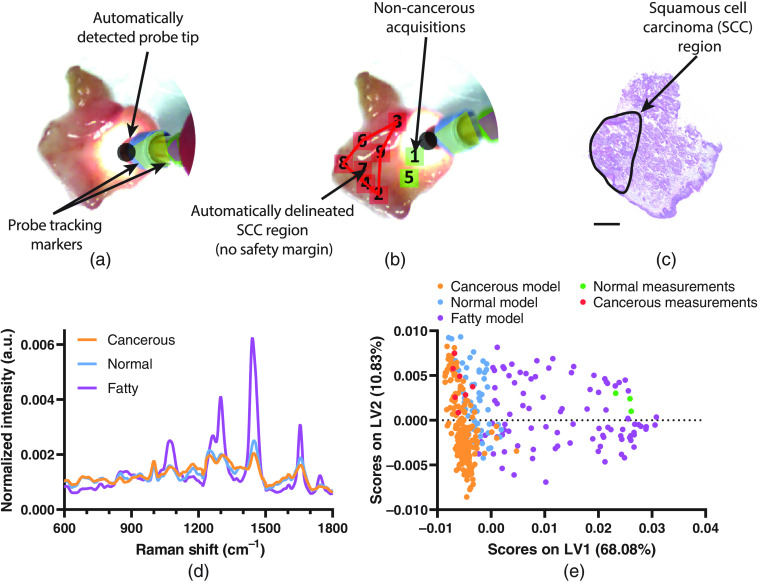
Fig. 2.
(a) White light image of the bulk SCC biopsy specimen prior to first Raman diagnostic acquisition. (b) White light image of the bulk tumor biopsy specimen with overlaid Raman spectral measurements and tumor margin delineation (red line) (no safety margin shown) where green squares indicate locations of negative (non-cancerous) measurements, red squares indicate locations of positive (cancerous) measurements, and the numbers inside each square indicate order of acquisition. (c) Adjacent H&E stained section of SCC biopsy specimen (scale bar = 2 mm). (d) Mean Raman spectra of cancerous, normal (non-fat), and fatty (normal) tissues ( to 4 tissues, spectra). (e) PLS-DA latent variable 1 and 2 (LV1 and LV2) scores for cancerous, normal (non-fat), and fatty (normal) tissues, where PLS-DA latent variables represent spectral features of descending importance that best enable separation of the different tissue classes.

