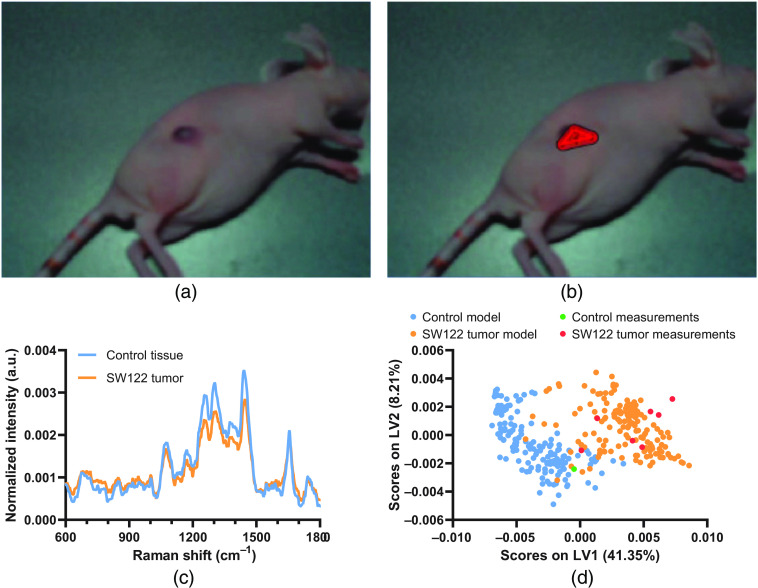
Fig. 3.
(a), (b) Screenshots from the image-guided Raman spectroscopic probe-tracking system GUI during spatial spectroscopic diagnosis of (a) an SW1222 colorectal xenograft tumor in a nu/nu mouse and (b) with AR Raman margin delineation overlay. (c) Mean Raman spectra of control tissue and SW1222 tumors (, ) used for PLS-DA. (d) PLS-DA latent variable 1 and 2 (LV1 and LV2) scores for control tissue and SW1222 tumors.

