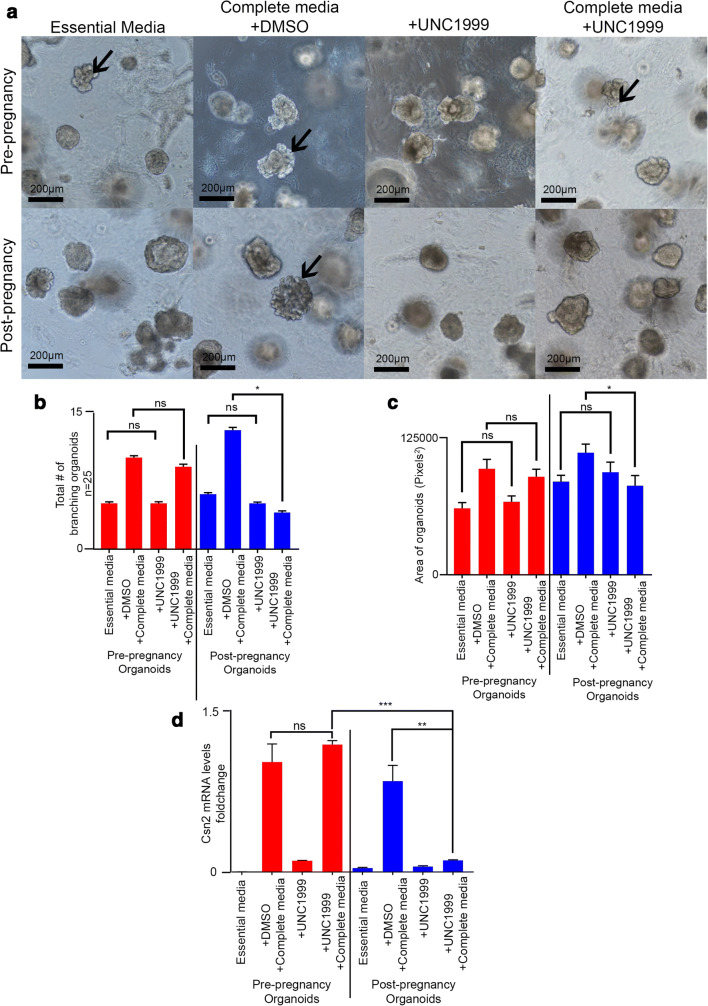
Fig. 4.
Utilization of organoid cultures to define players in pregnancy-induced development and post-pregnancy epigenome. (a) Representative brightfield images of mammary organoids treated with essential medium or complete medium, supplemented with either DMSO (Dimethyl sulfoxide, control), or EZH2 inhibitor UNC1999 for 48 h. Arrows indicated examples of branching organoids. Scale = 200 μm. (b) Branching quantification of pre- and post-pregnancy mammary organoid cultures treated with essential medium or complete medium, supplemented with either DMSO (control) or EZH2 inhibitor UNC1999. 13 fields of view per well/replicate. n = 25 organoids. ns = not significant; *p = 0.027 differences between post-pregnancy organoids treated with complete media and complete media with UNC1999. Error bars indicate standard error of the mean (SEM) across samples of same experimental group. p values were defined using Students t-test. (c) Size quantification of pre- and post-pregnancy mammary organoid cultures treated with essential medium or complete medium, supplemented with either DMSO (control) or EZH2 inhibitor UNC1999. n = 20 organoids per condition. ns = not significant; *p = 0.018 differences between post-pregnancy organoids treated with complete medium and DMSO and post-pregnancy organoids treated with complete medium and UNC1999. For analyses, error bars indicate standard error of the mean (SEM) across samples of same experimental group. p values were defined using Welch’s t-test. (d) Csn2 mRNA levels (qPCR) in pre- and post-pregnancy mammary organoid cultures treated with either essential medium or complete medium, with DMSO control or UNC1999. *p = 0.0364 differences between post-pregnancy organoids treated with complete medium and DMSO and post pregnancy organoids treated with complete medium and UNC1999. ***p = 0.0009 differences between pre-pregnancy organoids treated with complete medium and UNC1999, and post-pregnancy organoids treated with complete medium and UNC1999. Error bars indicate standard error of the mean (SEM) across samples of same experimental group. p values were defined using Welch’s t-test

