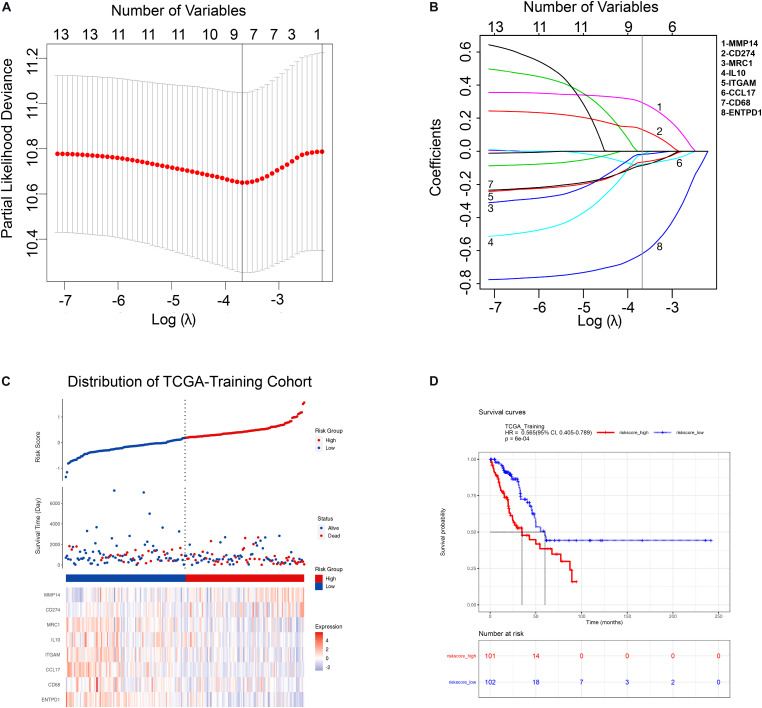
FIGURE 2.
Construction of TAM risk model in TCGA-training cohort. (A) Optimized lambda determined in the LASSO regression model. A vertical line is drawn at the value chosen by 10-fold cross-validation. (B) The LASSO coefficient spectrum of the 13 TAM-related genes. (C) Expression heatmap of identified 8 genes and corresponding risk score as well as survival status of patients in TCGA-training cohort. (D) KM survival curve for high- and low-risk group patients in TCGA-training cohort.

