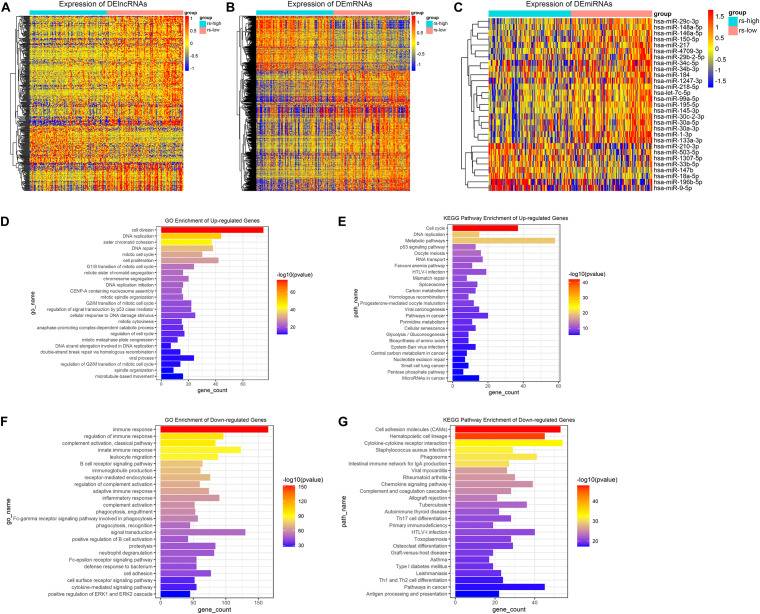
FIGURE 4.
Differential gene expression analysis and function annotation. Heatmaps demonstrate expression of DElncRNAs (A), DEmRNAs (B), and DEmiRNAs (C). The top 25 enriched GO biological processes (D) and KEGG pathways (E) of the significantly upregulated genes. The top 25 enriched GO biological processes (F) and KEGG pathways (G) of the significantly downregulated genes.

