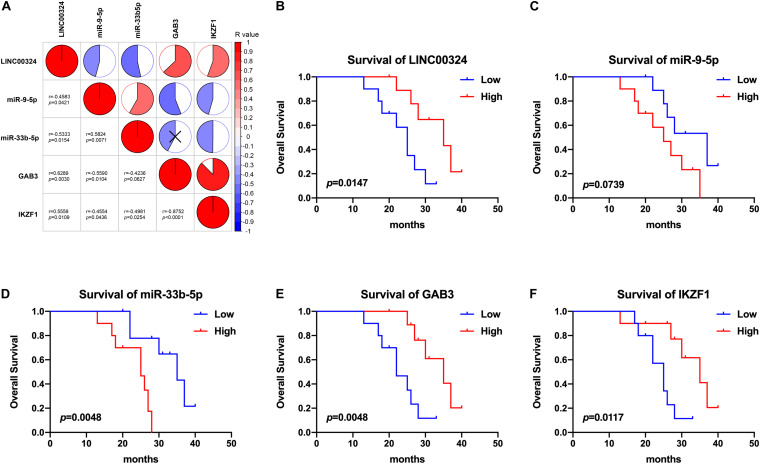
FIGURE 9.
Correlation and survival analysis of the core regulatory axis in clinical samples. (A) Correlations between LINC00324, miR-9-5p, miR-33b-5p, GAB3, and IKZF1. Results were analyzed according to gene relative expression achieved by qRT-PCR and correlations were tested using Pearson correlation coefficient. Kaplan-Meier analyses of overall survival in LUAD patients with low (n = 10) and high (n = 10) LINC00324 (B), miR-9-5p (C), miR-33b-5p (D), GAB3 (E), and IKZF1 (F) expression.

