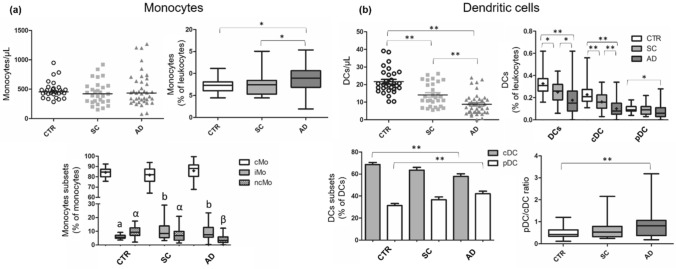
Figure 1.
Absolute and relative numbers of monocytes and DCs in healthy controls, stable cirrhosis and in acute decompensation of cirrhosis. A series of comparisons of absolute and relative numbers of monocytes (Panel a) and DCs (Panel b) obtained by manual gating and differences among study groups. *p ≤ 0.05; **p ≤ 0.01. In Panel (a), a and b: difference between SC and CTR and AD and CTR (p ≤ 0.01), α and β: difference between AD and CTR and AD and SC (p ≤ 0.01). AD Acute decompensation of cirrhosis, cDC Classical dendritic cell, cMo Classical monocytes, CTR Healthy controls, DCs Dendritic cells, iMo Intermediate monocytes, ncMo Nonclassical monocytes, pDC Plasmacytoid dendritic cell, SC Stable cirrhosis. Differences were tested using Kruskal–Wallis or ANOVA/Bonferroni. Parametric variables are represented by boxplot with a “ + ” (mean) or by column chart.

