Figure 2.
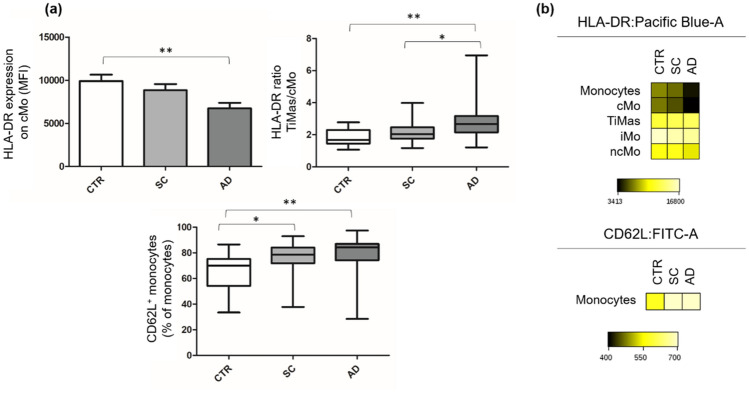
HLA-DR and CD62L expression on monocytes. Panel (a) HLA-DR and CD62L expression on monocytes of healthy controls, stable cirrhosis and in acute decompensation of cirrhosis.Values are represented as MFI of HLA-DR expression and percentage of CD62L+ monocytes. Panel (b) Heatmap of the FCS files of 30 CTR, 29 SC and 39 AD merged together. The colors in the heatmap represent the median of the intensity of HLA-DR and CD62L expression on monocytes, varying from black for lower expression to light yellow for higher expression. *p ≤ 0.05; **p ≤ 0.01. AD Acute decompensation of cirrhosis, cMo Classical monocytes, CTR Healthy controls, MFI Mean fluorescence intensity, SC Stable cirrhosis, TiMas Tissular macrophages. Differences were tested using Kruskal–Wallis or ANOVA/Bonferroni. Parametric variables are represented by column chart.

