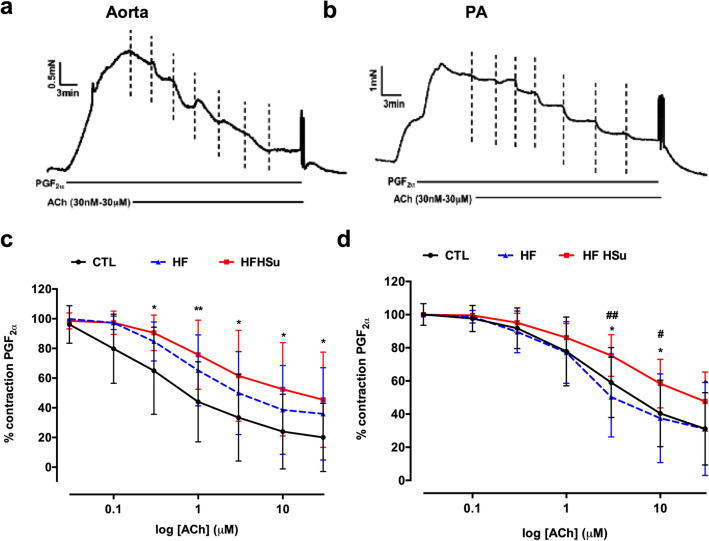
Figure 2.
Effect of type 2 diabetes progression on endothelial function in aorta and pulmonary artery (PA). Typical trace of a dose response relaxation curve to different concentrations of ACh (0.03–30 µM) in the aorta (a) and pulmonary artery (b). Average responses in the aorta (c) and pulmonary artery (d) of the dose response relaxations in control (n = 10–14), HF (n = 10–11) and HFHSu (n = 10) animals. Values are presented as mean ± SD. Curves compared using two-way ANOVA with Dunnet’s Multiple Comparison test. *p < 0.05 and **p < 0.01 versus control animals; #p < 0.05 and ##p < 0.01, HF versus HFHSu animals.

