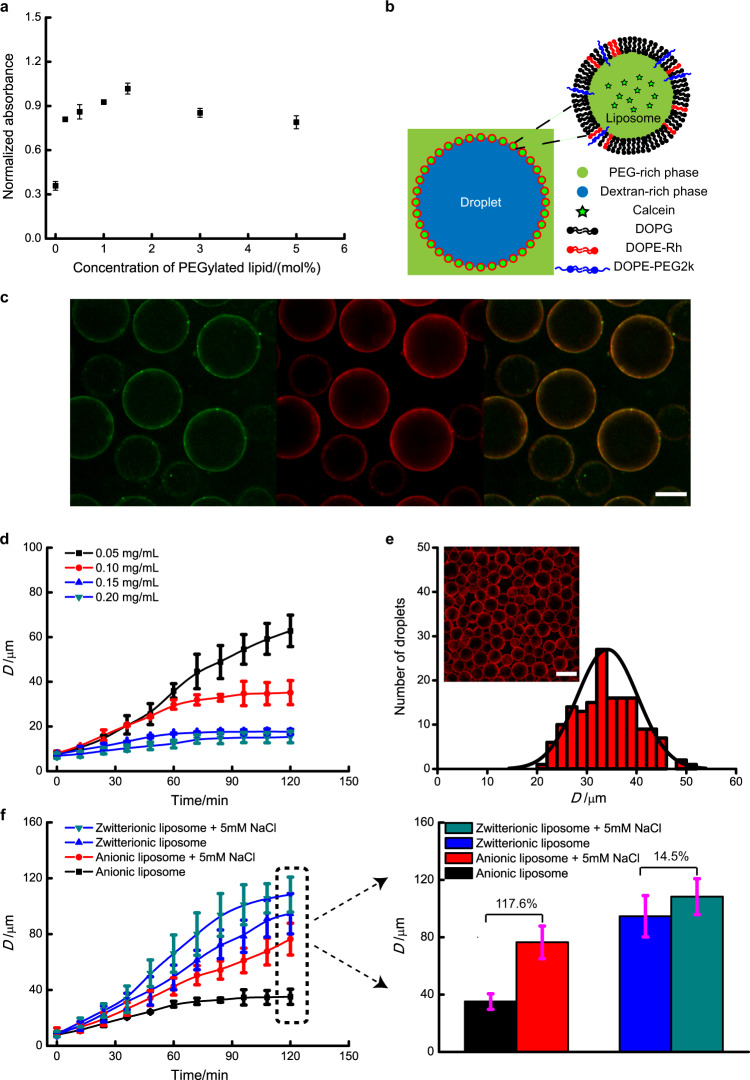
Fig. 2. Characterisation of droplet morphology and stability.
a Normalised absorbance (at 650 nm) 8 h after emulsion formation. If emulsions stay stable, it should remain turbid during observation, i.e. the normalised absorbance remains unchanged. A decrease in normalised absorbance can be observed for unstable emulsions. Error bars represent 1 s.d. (n = 3) for each data set. b Illustration of a liposome-stabilised droplet. DOPG, DOPE-Rh and DOPE-PEG2k corresponds to 1,2-dioleoyl-sn-glycero-3-phospho-(1′-rac-glycerol) (sodium salt), 1,2-dioleoyl-sn-glycero-3-phosphoethanolamine-N-(lissamine rhodamine B sulfonyl) (ammonium salt), and 1,2-dioleoyl-sn-glycero-3-phosphoethanolamine-N-[methoxy(polyethylene glycol)-2000] (ammonium salt), respectively. c Droplets stabilised by Calcein-containing (5 mM) liposomes. From left to right, Calcein channel, Rhodamine channel and an overlay of the calcein and rhodamine channels. Colours were added via Image J. Liposome solution is diluted after size exclusion, which leads to the large droplet size. Scale bar is 50 μm. d Effect of liposome concentration on droplet stability. D is droplet diameter. Error bars represent 1 s.d. (n = 50) for each data set. e Droplet size distribution for stable droplets (stabilised with DOPG liposomes). The inset picture corresponds to droplets at 120 min for 0.10 mg/mL in (d). Scale bar is 50 μm. f Effect of liposome type and salt addition on droplet stability. Droplet diameter at 120 min was extracted to draw a histogram in order to show the difference of salt addition on different liposome-stabilised droplets. Error bars represent 1 s.d. (n = 50) for each data set.

