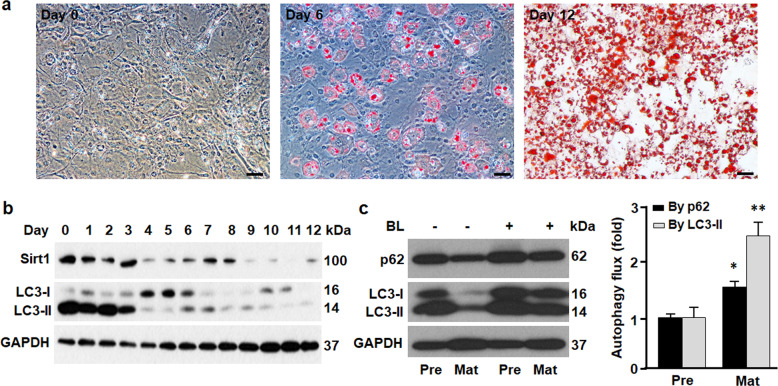
Fig. 1. Adipogenesis was associated with downregulation of Sirt1 and activation of autophagy.
a Oil red O staining of 3T3L1 cells during differentiation, showing the data of day 0 (preadipocyte), day 6 (differentiating adipocyte), and day 12 (differentiated or mature adipocyte). Scale bar, 50 µm. b Western blotting analysis of Sirt1 and LC3 proteins during 3T3L1 cell differentiation. GAPDH was probed as a loading control. c Autophagy flux was determined by contrasting the rates of removing the substrates LC3-II and p62 by autophagy in the absence and presence of autophagy inhibitors BL (bafilomycin A1 at 0.1 μM and leupeptin at 10 μg/ml). Pre, preadipocyte; Mat, mature adipocyte. *p < 0.05; **p < 0.01. n = 8.

