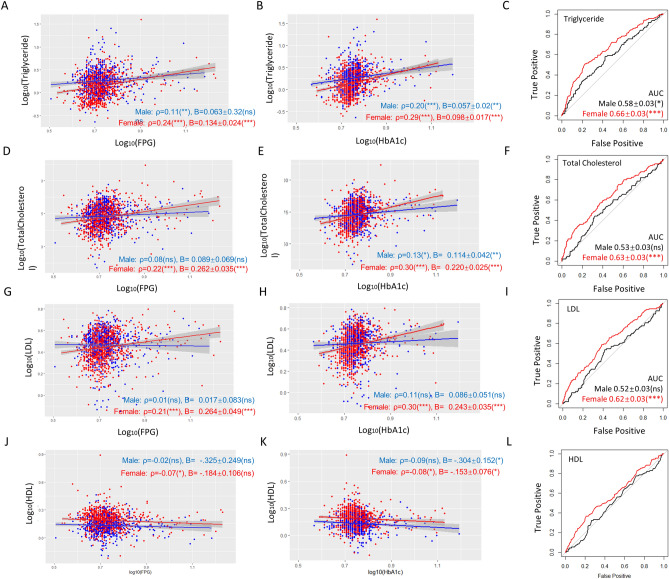
Figure 3.
Triglyceride, total cholesterol, and LDL predict T2D better in women than in men. (A,B) Triglyceride has a tighter association (Spearman’s ρ) with FPG and HbA1c in women and affects FPG and HbA1c stronger (steeper slope) in women. P values, regression constant can be found in Tables S2 and S3. (C) Triglyceride is a stronger T2D predictor for women as judged by ROC-AUC analysis. (D,E) Total cholesterol levels tend to have tighter associations with FPG and HbA1c in women and affect FPG and HbA1c levels stronger in women. (F) Total cholesterol is a stronger T2D predictor for women. (G,H) LDL levels associate with FPG and HbA1c stronger in women and tend to affect FPG and HbA1c levels stronger in women. (I) LDL levels predict T2D in women but not men as judged by ROC-AUC analysis. (J,K) HDL has a very weak, negative correlation with FPG and HbA1c and shows no sex-difference. (L) HDL predicts T2D better in women than in men. AUC area under the curve, ns not significant, *P < 0.05, **P < 0.01, ***P < 0.001.

