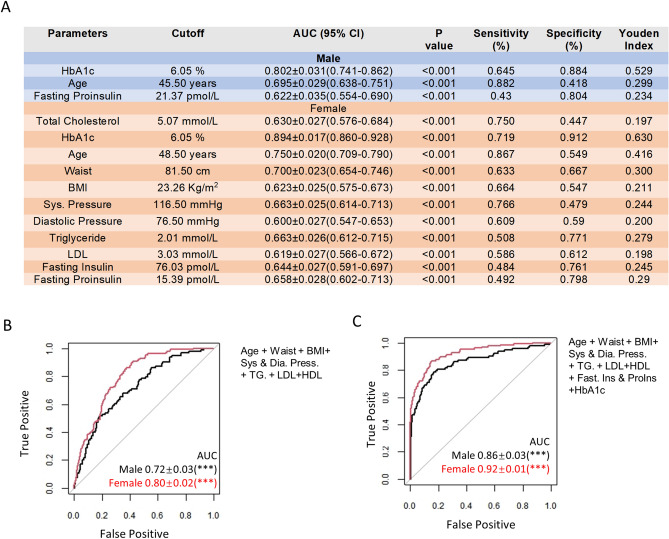
Figure 5.
Sex-difference in the cutoffs of the predicting parameters individually or in combination. (A) The cutoffs of 3 parameters in men and 11 parameters in women having significant (P < 0.05) prediction power (ROC-AUC values > 0.6). A comprehensive comparison between men and women on the cutoffs, ROC-AUC values, sensitivity, specificity, and Youden Index is shown in Table S4. (B) A combination of age, waist, BMI, systolic and diastolic blood pressure, triglyceride, LDL, and HDL in T2D prediction by ROC analysis. (C) A combination of fasting insulin and proinsulin and HbA1c with parameters in (C) for T2D prediction. AUC area under the curve, ***P < 0.001.

