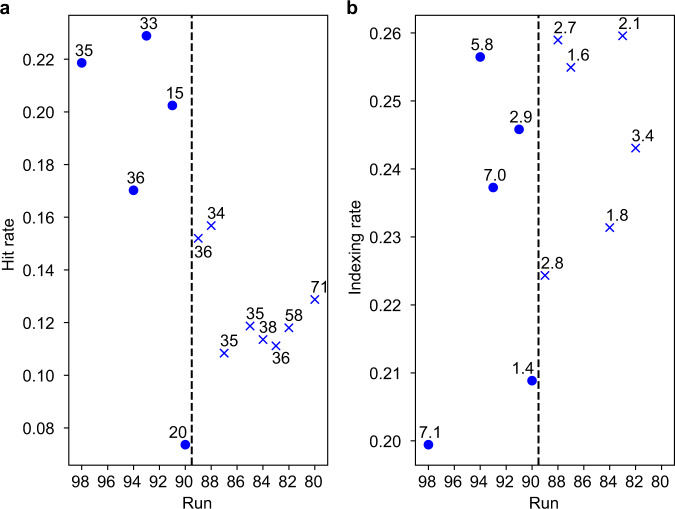
Fig. 2. Hit and indexing rates in pump–probe and probe-only runs.
a Hit rate as a function of run number for single-pulse (circles) and pump–probe (crosses) runs. The hit rate was calculated as the number of hits divided by the number of shots comprising a run. The average value of the hit rate is 13% in the pump–probe data set and 19% in the single-pulse data set. All hits prior to filtering were taken into account (43,003 hits for the pump–probe and 25,742 hits for the single-pulse data set). The number above each data point indicates the number (in thousands) of X-ray shots per run. b Indexing rate as a function of run number for single-pulse (circles) and pump–probe (crosses) runs. The indexing rate was calculated as the number of indexed hits divided by the total number of hits in a run. The average indexing rate was 24% in the pump–probe data set and 23% in the probe-only data set, leading to 3531 and 5541 indexed images in the pump–probe and single-pulse data set, respectively. Only hits satisfying the diode signal and jet image filtering conditions (see “Methods” section) were taken into account. The number above each data point indicates the number (in thousands) of indexed hits per run. For two runs (run 80 and 85), the jet imaging time delay varied and the jet images could thus not be analysed as to whether a shock wave had been launched that could successfully propagate to the jet segment to be probed. Therefore, all hits from these runs were excluded from the analysis and the post-filtering indexing rate is not defined.

