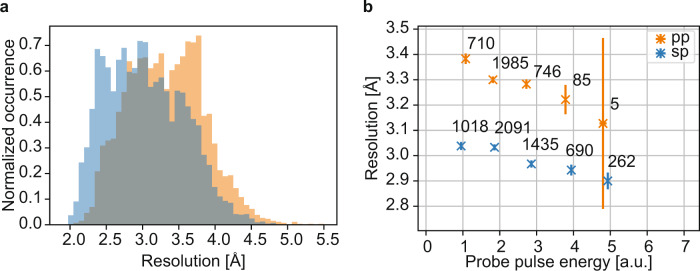
Fig. 3. Resolution of the single-pulse and pump–probe SFX data.
a Normalized histogram of the resolution of all indexed hits of the pump–probe (orange) and single-pulse reference (blue) data set. The median resolution of all indexed hits is 3.3 Å in the pump–probe case and 3.0 Å for the single-pulse reference data. b Diffraction resolution of the pump–probe (orange) and the single-pulse (blue) data set as a function of probe pulse energy. Indexed haemoglobin diffraction patterns were binned according to the probe pulse energy measured by the X-ray sensitive photo diode masked with an Fe foil of same thickness as the Fe filter in front of the CSPAD detector. The median resolution of all indexed diffraction images contained in one probe pulse energy bin is plotted. The error bars correspond to the error of the mean per bin. The number next to each data point indicates the number of indexed diffraction patterns within a given bin. For all probe pulse energies, the resolution of the pump–probe data is consistently lower than the resolution of the single-pulse reference data, indicating that the observed effect is not caused by a difference in changing probe pulse energy conditions between the two data sets (Supplementary Fig. 4). Equalization of probe pulse energy distributions (Supplementary Methods) between the two data sets leads to the same conclusion (Supplementary Fig. 5). The resolution limit (a, b) corresponds to the highest resolution value of an indexed diffraction peak with a signal-to-noise ratio of I/σ(I) ≥ 4.

