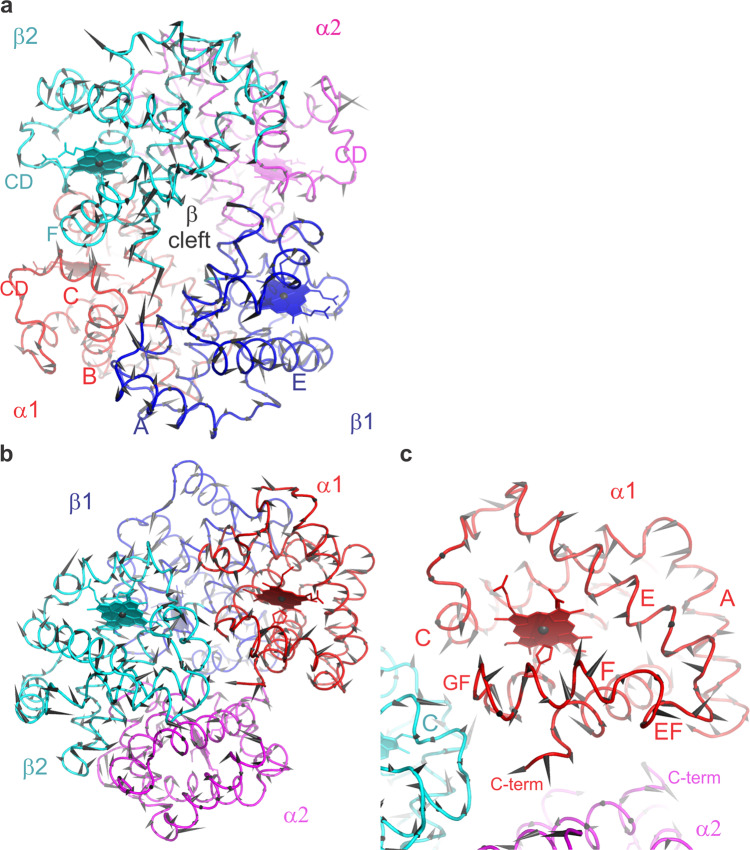
Fig. 4. Structural comparison of the single-pulse and pump–probe Hb.CO structures.
The displacement between respective Cα positions is indicated by black arrows. The magnitude of the displacement is illustrated by the length of the arrows (multiplied by a factor of 10). a, b Different orientations of the haemoglobin tetramer. The fact that clusters of arrows point in similar directions shows that the displacements are correlated both within and between secondary structure elements. To ease visualization of the displacements, Supplementary Movie 4 shows a morph between the two structures. The proximal histidines are shown as sticks. c A magnified view of the α1 subunit (similar orientation as in b). Correlated displacements of the F helix towards the haem are clearly visible. a, b, c The alpha subunits are shown in red and magenta, beta subunits in blue and cyan. Helices are labelled by capital letters (A, B, C…), loops between helices by the two letters corresponding to the respective helices (e.g., EF loop region connecting the E and F helices); haem planes are depicted as filled planes.

