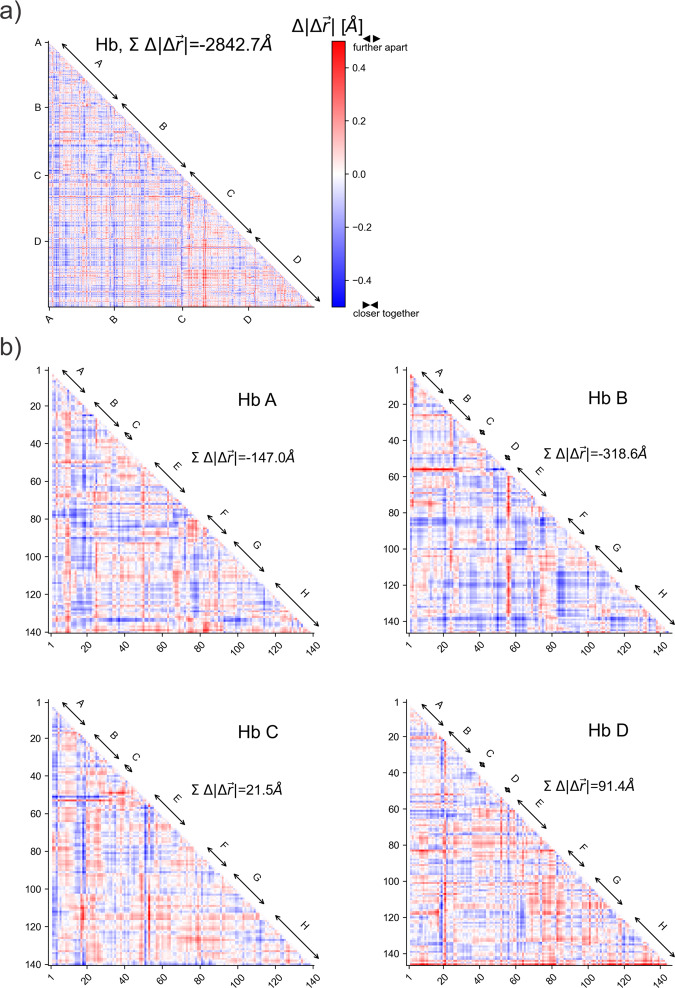
Fig. 5. Distance matrices showing the relative displacement of Cα–Cα pairs when comparing structures determined using the single-pulse data and the pump–probe data.
Red indicates an increase of the distance, blue a decrease. The blue features dominate in the plot of the haemoglobin tetramer (a), as well as in the plots of the α1 (HbA) and β1 (HbB) subunits (b) indicating a clear compaction of the structure (see Supplementary Fig. 13). In contrast the α2 (HbC) and β2 (HbD) subunits slightly expand (b). Compaction and expansion are also clearly apparent from the sum of the relative changes. Correlated movements of secondary structure elements can be observed in the plots as extended streaks of blue or red colour (e.g., parts of the α1-A helix move closer to the core of the α1 subunit, similarly part of the β1 EF loop and the F helix move closer to the β1core, etc.).

