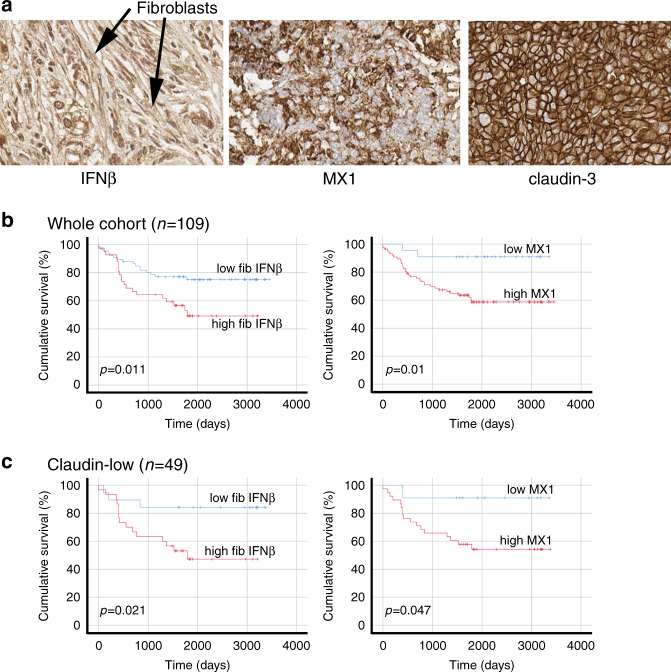
Fig. 5. In primary cancers, IFNβ1 in CAFs and MX1 in cancer cells correlate with each other and with poor survival.
TMAs of tissue from 109 TNBC resections were assembled and expression of IFNβ1 in fibroblasts, and MX1 and claudin-3 in tumour cells was determined using immunohistochemistry. a Representative images of immunohistochemistry, showing tissue scored ‘3’ for IFNβ in fibroblasts (left), ‘3’ for MX1, and ‘positive’ for claudin-3. b The cohort was split into groups with high or low expression of IFNβ1 in fibroblasts (left) or MX1 in tumour cells (right) using ROC analyses. Cumulative disease-free survival in the groups was compared using Kaplan-Meier analyses and log rank tests. c The cohort was split into claudin-low or claudin-high groups, based on expression levels of claudin-3 (positive or negative). The claudin-low group (n = 49) were analysed as in b.

