
Fig. 3. AAV2-5HRE-bFGF-NSCs improve the histopathology in SCI rats.
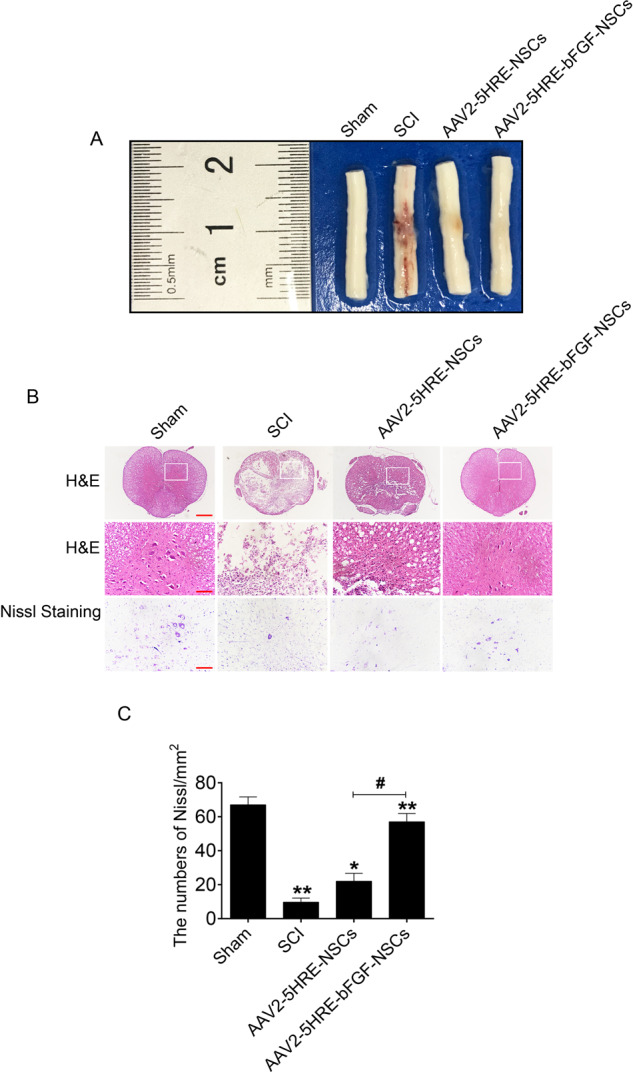
A Anatomical observation of the spinal cord of rats. B H&E staining (cross-section) and nissel staining images for the sham group, SCI group, AAV2-5HRE-NSCs group and AAV2-5HRE-bFGF-NSCs group, scale bar = 500 µm. Representative regions with high power magnification were also presented, scale bar = 100 µm. Nissl staining of the different groups, scale bar = 100 µm. C Quantitative analysis of the nissl staining results. “**” represents P < 0.01 or “*” represents P < 0.05, versus sham group or SCI group. “#” represents P < 0.05, versus the AAV2-5HRE-NSCs group. Data are the mean values ± SEM (n = 6).