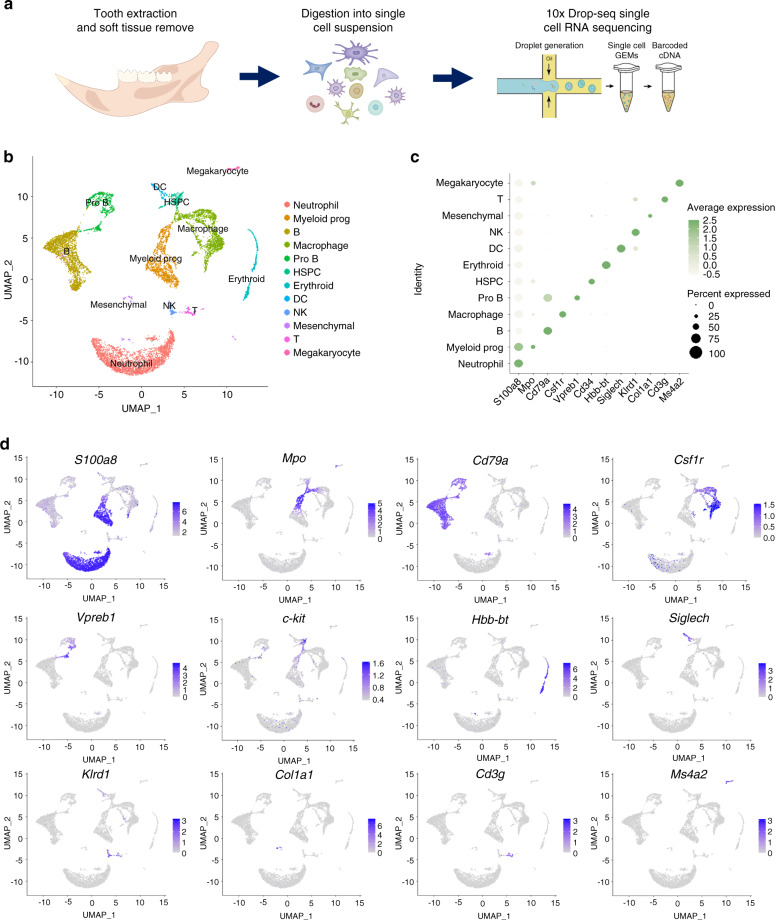
Fig. 1.
Characterization of the single-cell atlas of alveolar bone. a Flow chart of preparation of scRNA-seq samples from mouse mandibular alveolar bone. b Cells identified by scRNA-seq were visualized with UMAP. Different cell populations were defined and distinguished by color. Each point represented an independent cell. c Specific expression of marker genes in different cell types. d The expression levels of marker genes were projected onto UMAP atlas

