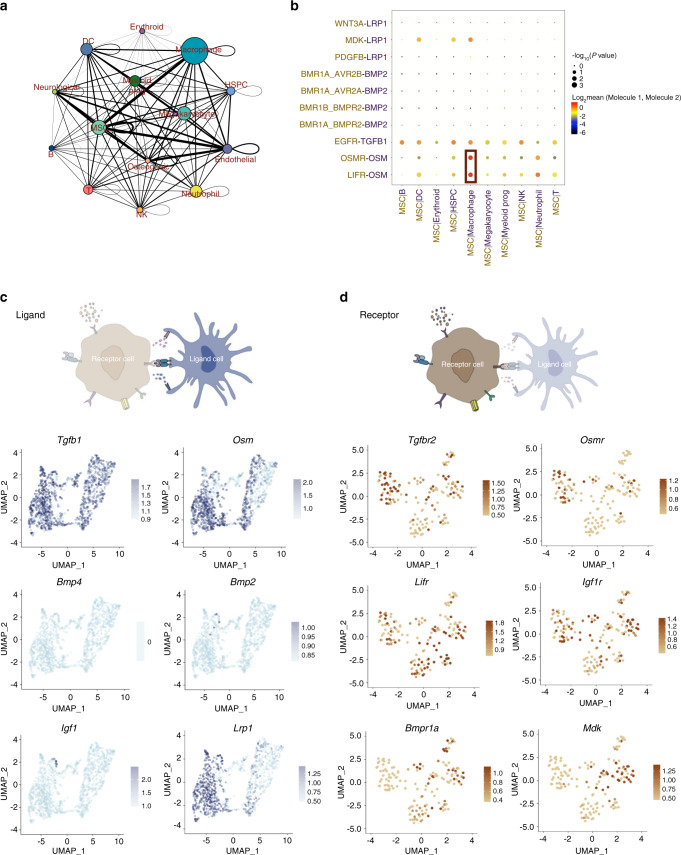
Fig. 2.
Cell–cell interaction between immune cells and stromal cells in alveolar bone marrow. a Network diagram of the cell–cell interaction of different cells in the alveolar bone marrow. The size of the circle represented the number of interactions with all other types of cells, and the thickness of the line represented the interaction number of cells between the line. b Visualization of the selected macrophage-MSC crosstalk pathway. c Expression of the ligands in monocytes/macrophages. d Expression of the receptors in stromal cells (MSC, osteoblasts, endothelial cells, neurological cells)

