Fig. 3.
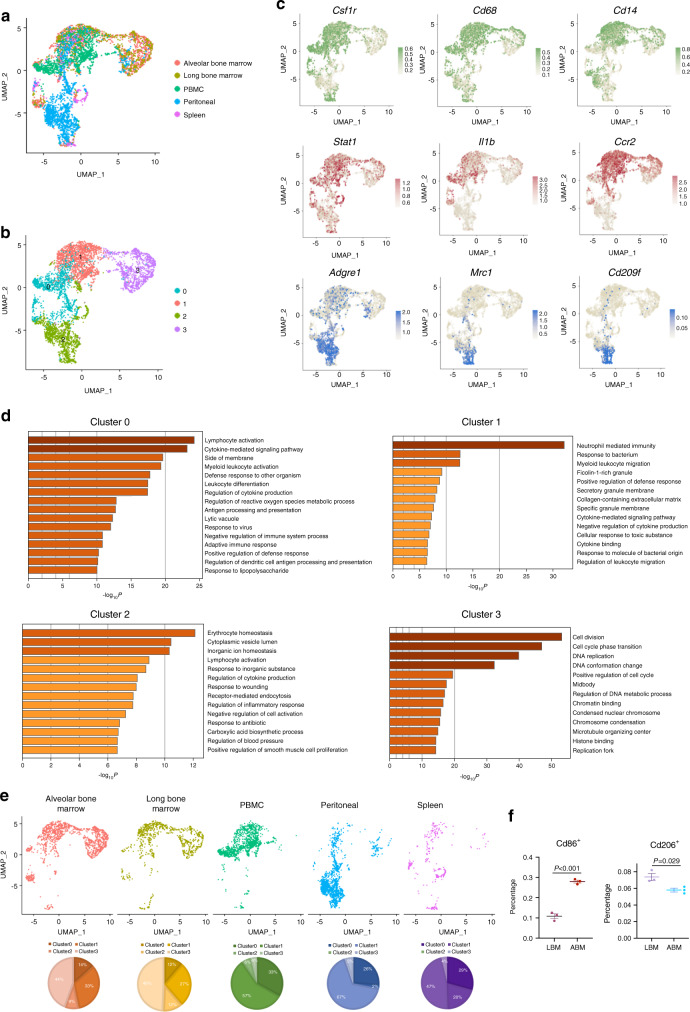
Comparative analysis of the heterogeneity of monocytes/macrophages. a Monocyte/macrophage population after merging five scRNA-seq datasets was visualized with umap plot. b Identification of the 4 subclusters of Monocyte/Macrophage population. c The expression of classic macrophage polarization markers in monocyte/macrophage population. d GO enrichment analysis of the biological functions of different subclusters. e Distribution of cells on umap plot split by tissue origins. f Flow cytometry analysis of the ratio of Cd86+ and Cd206+ macrophages in alveolar bone marrow and long bone marrow

