Figure 1.
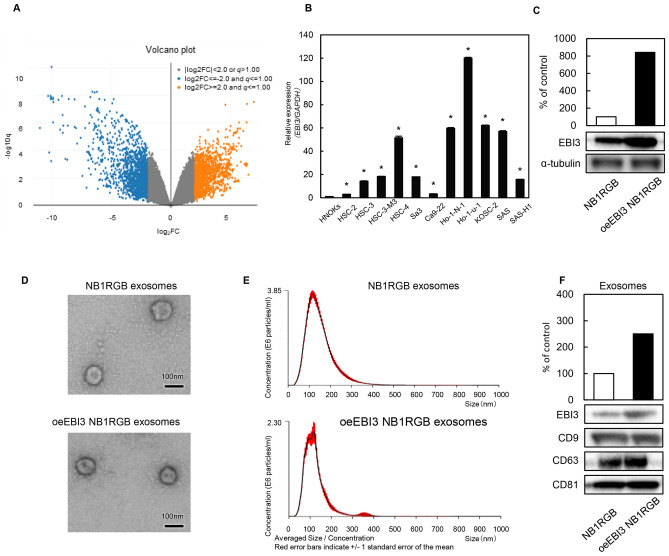
Expression of EBI3 in OSCC, normal cells and exosomes. (A) Volcano plots of significant genes with P < 0.01 and more than a two-fold change or less than a 0.5-fold change expressed in 1536 upregulated genes and 3381 downregulated genes. The x-coordinate represents the (log2) fold-change (FC) and y represents the t-statistic or − log10q of the P value. (B) A qPCR analysis of EBI3 transcripts in HNOKs and OSCC cell lines. The levels of EBI3 transcripts were normalized to the expression of GAPDH. Data are expressed as ratios of EBI3 to GAPDH. Data are presented as means ± SD (n = 3). *P < 0.05. (C) Increased EBI3 in transfected NB1RGB cells was evident when compared to the mock cells. Densitometric EBI3 protein data were normalized to α-tubulin protein levels. (D) Electron micrograph of NB1RGB exosomes and oeEBI3 NB1RGB exosomes. (E) Size distribution of NB1RGB exosomes and oeEBI3 NB1RGB exosomes measured by NTA peaking at 100 nm diameter. (F) EBI3 Western blots of the corresponding exosomes. Note that EBI3-transfected NB1RGB cells released greater amounts of EBI3-expressing exosomes than control cells. CD9, CD63 and CD81 expressions were analyzed as an exosomal markers.

