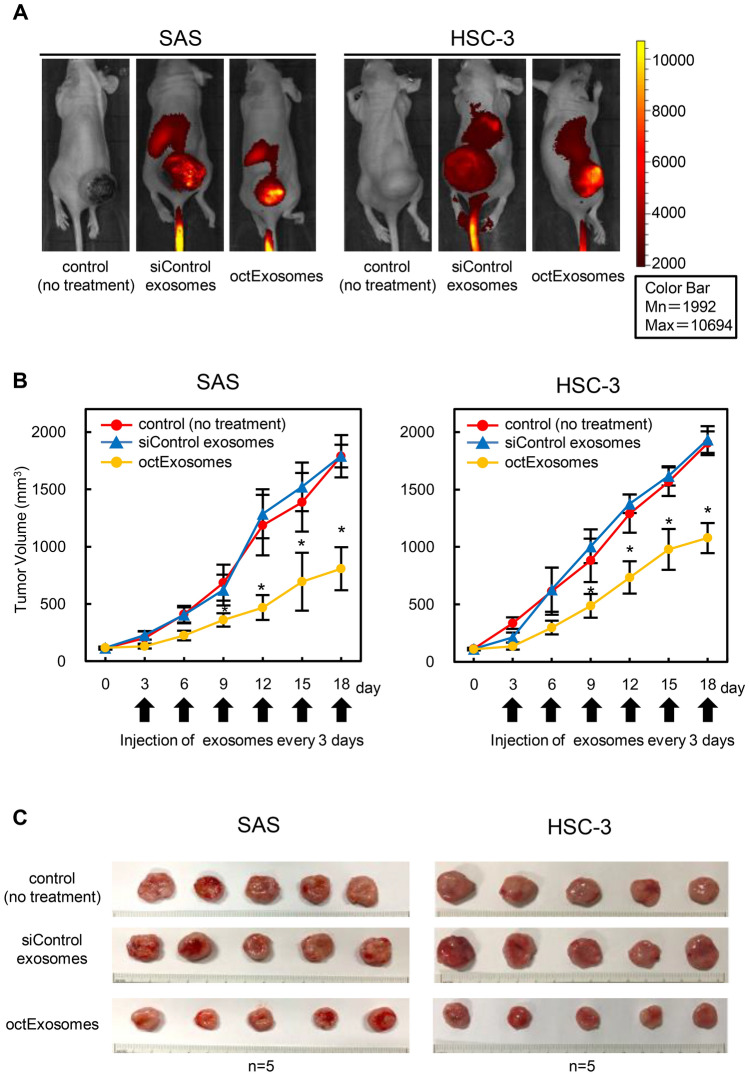
Figure 5.
In vivo fluorescent images of SAS and HSC-3 tumor-bearing mice after i.v. injections of exosomes. (A) Fluorescent images of whole-body imaging of SAS and HSC-3 tumor-bearing mice after treatment with exosomes. Strong accumulation of fluorescence was observed by whole-mouse imaging in the tumor area. (B) Tumor volume growth curves. (Arrows, i.v. injections of exosomes; data are presented as mean ± SD. N = 5. *P < 0.05). (C) Pictures of local tumors from mice bearing SAS cells or HSC-3 cells. Based upon the series of transplantations, we confirmed that tumor growth was suppressed at considerably higher levels in the octExosome group than in siControl exosome and control groups.

