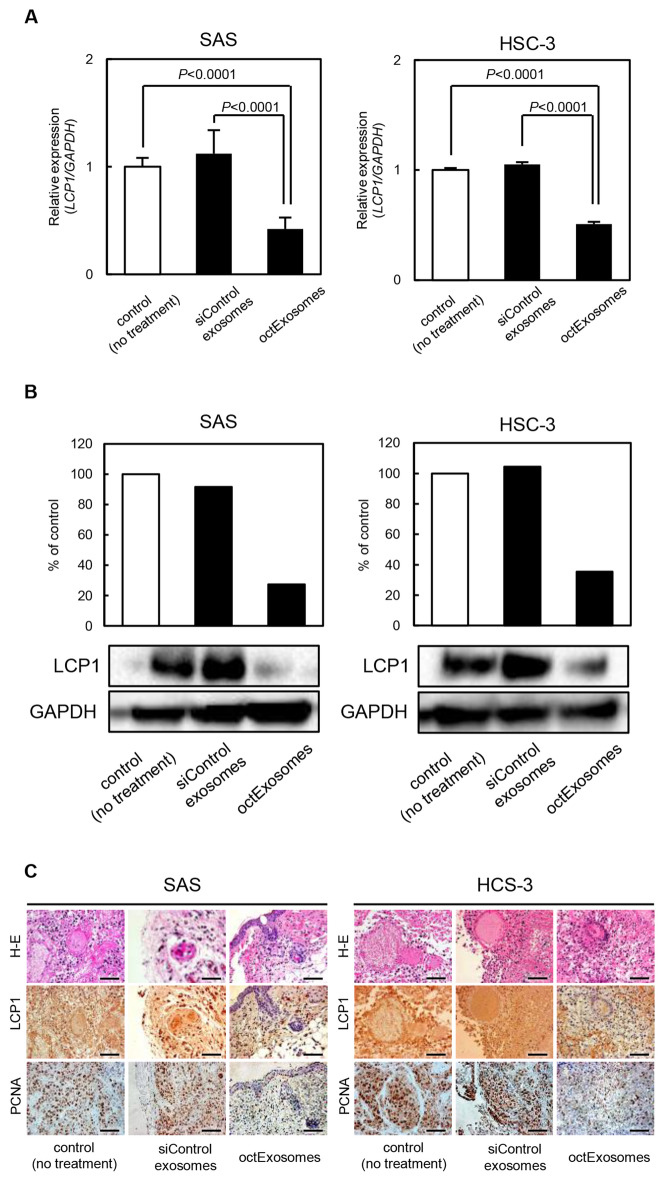
Figure 6.
Tumor xenograft studies after i.v. injections of exosomes. (A) Quantitation of LCP1 mRNA change. (Data are presented as means ± SD. N = 5. *P < 0.05.) (B) Quantitation of LCP1 protein change. A, B. Based on qPCR and Western blot analyses. Note that LCP1 was considerably suppressed in the octExosome group compared to siControl exosome and control groups at both the mRNA level and protein level. (C) Immunohistochemical analysis of tumor LCP1 and PCNA changes. LCP1 and PCNA expressions were considerably suppressed in the octExosome group. Scale bars indicate 50 μm.

