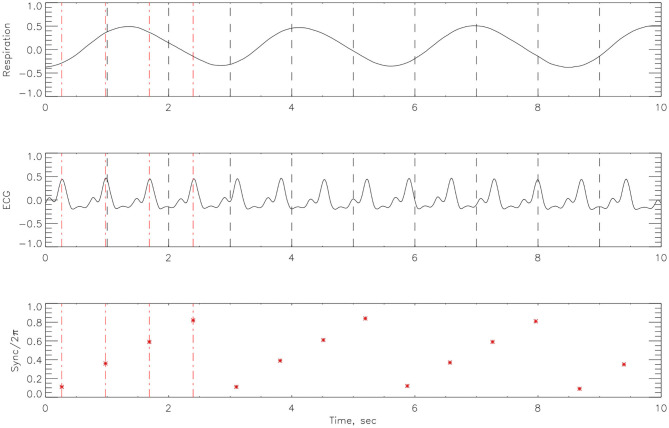
Figure 3.
An example of how the cardiorespiratory synchrogram works. On the top is the respiration, in the middle the corresponding ECG signal and at the bottom, the formation of the synchrogram. The position of each heartbeat in relation to its appearance in the phase of the respiratory cycles can be clearly seen. Red broken vertical lines indicate picks in the heart beats and black vertical broken lines indicate 1 s interval. This example illustrates n:1 synchronization.

